Analytics Tools for Tech Firms (Beyond Google Analytics): Survey Results


Summary
- Google Analytics dominates — used by 96.3%, mostly Universal Analytics
- Popular alternatives — SEMrush, Ahrefs, HubSpot, Hotjar, Clarity
- Marketing teams lead analytics use, followed by Sales and C-level roles.
- Main focus: traffic & conversions — core metrics for most teams.
- AI tracking adoption growing — 52.4% already using AI tools like SEMrush AI, Ahrefs Brand Radar.
- CookieYes leads in compliance tools, followed by Cookiebot and OneTrust.
- Top priorities: cost, ease of use, and accuracy.
- Top challenges: complexity, data accuracy, and integration.
- Overall, teams are “pretty happy” — average score: 3.7/5, with room to improve.
Businesses take daily actions to grow, but how effective are these actions? What key areas still need improvement? These questions can only be answered through proper analysis. Analytics tools are essential for understanding what works and what doesn’t.
They allow you to find technical or content problems and show if your business is heading in the right direction. This information helps you optimize your budgets and marketing strategies and make informed decisions to reduce risks.
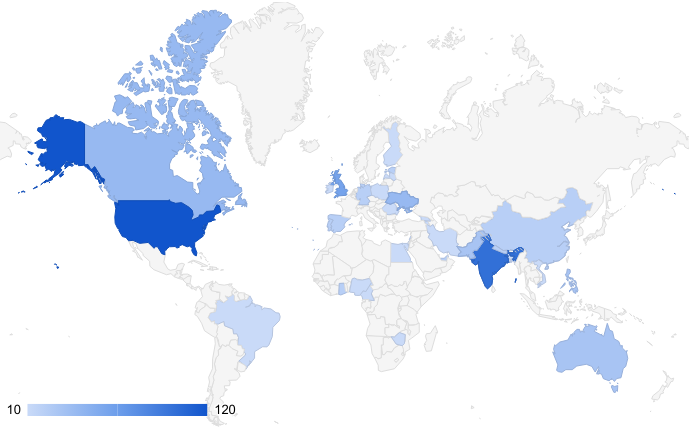
To deepen our understanding, we surveyed 830 IT companies across 34 countries from June 2nd to June 24th, 2025. Our goal was to gather insights on which alternative analytics tools, besides Google Analytics, tech professionals rely on, the benefits and challenges they face, and how these tools affect decision-making and efficiency.
We encourage you to review the detailed findings and consider them for your analytical strategies.
Who Took Part in the Survey?
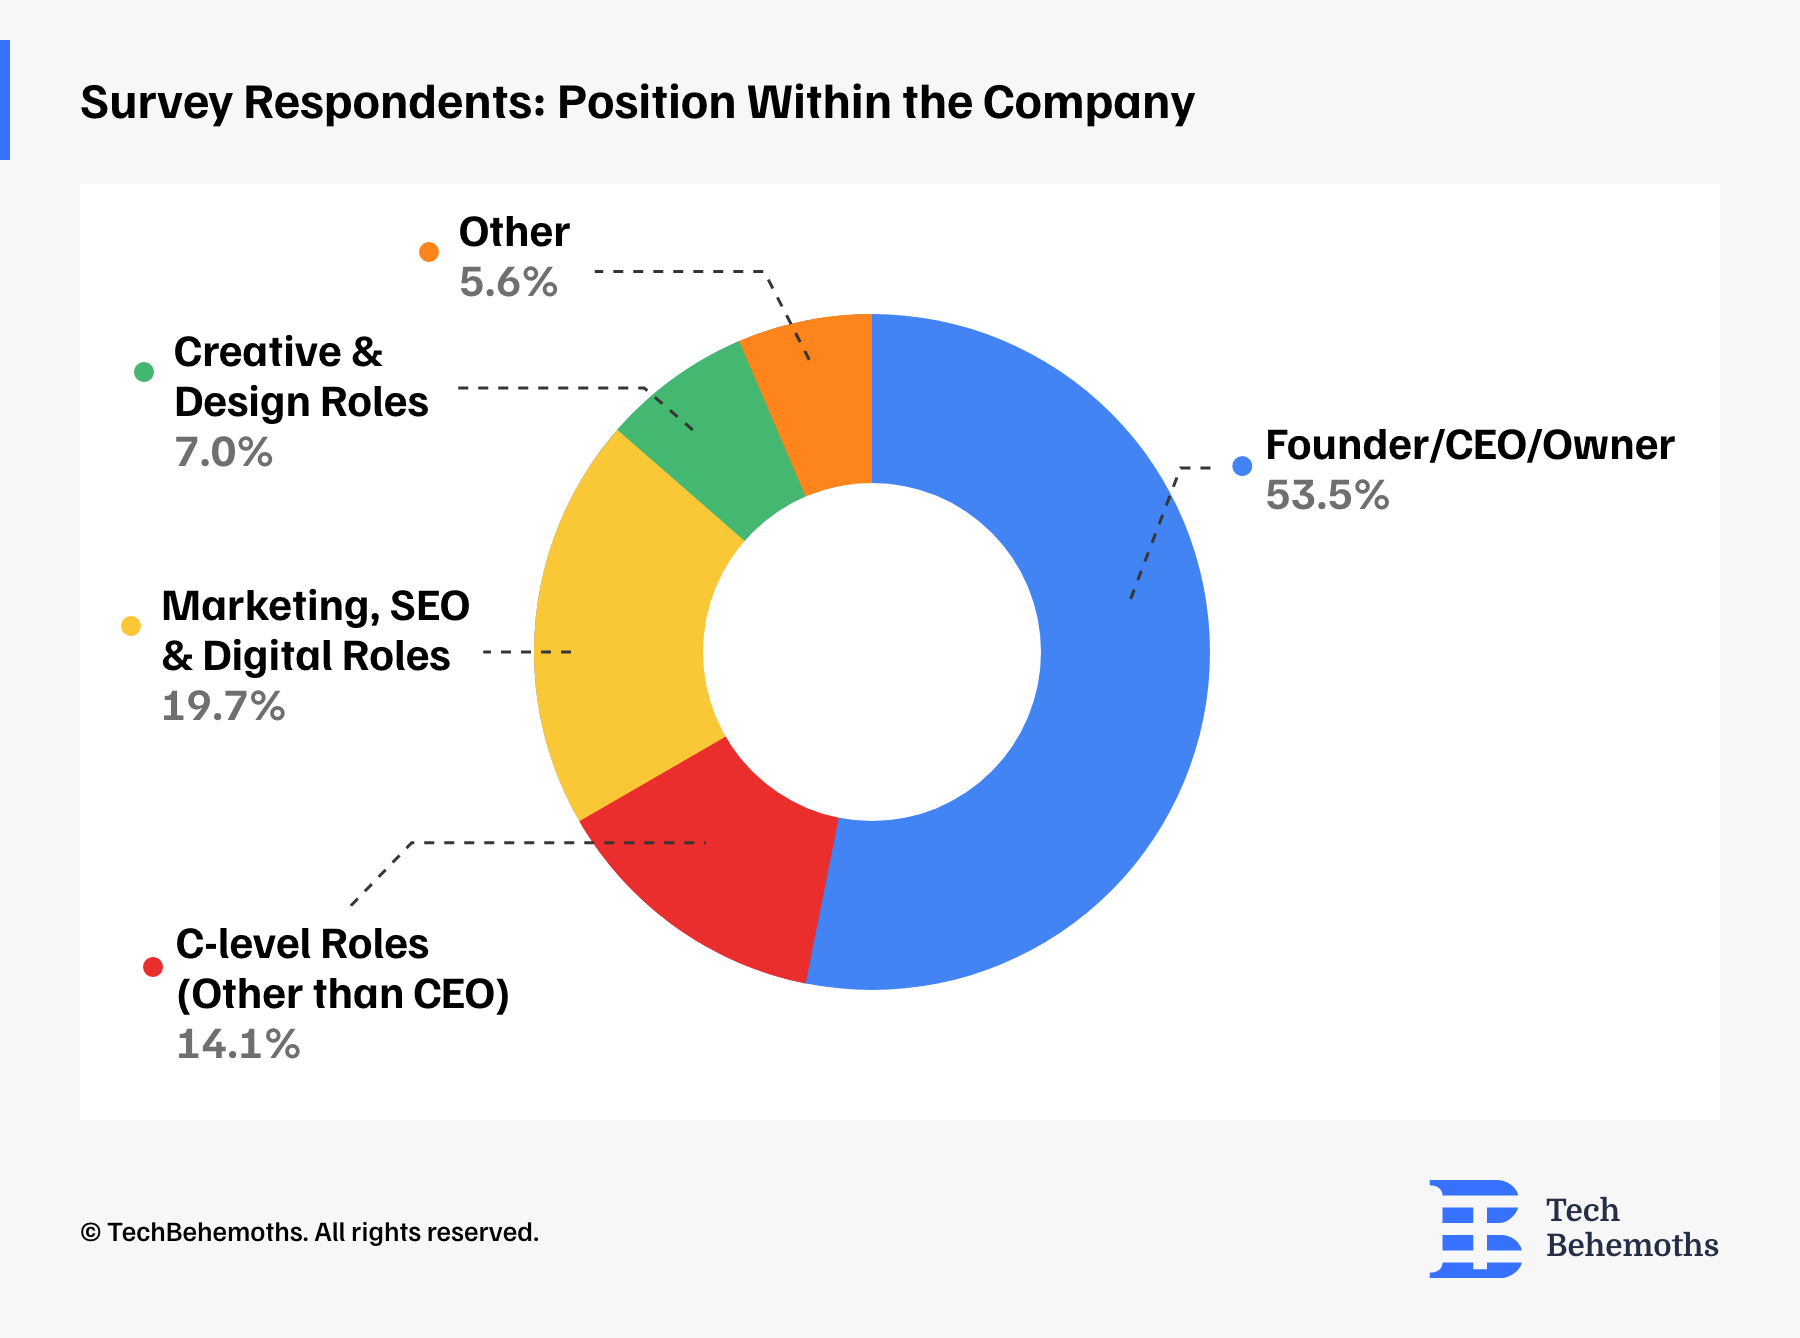
Our survey included a diverse group of professionals, offering valuable insights into how companies think and operate:
Founders, CEOs, or Owners (53.5%) – representing nearly half of all participants
Marketing, SEO & Digital Roles (19.7%) - provided perspectives from those directly involved in growth, visibility, and analytics
C-level roles (excluding CEOs), such as CTOs, COOs, or CFOs (14.1%) - shared executive insights from technology, operations, and finance departments
Creative & Design Roles (7%) - contributed ideas related to user experience and branding. A very small group (5.6%) included other positions, like admin assistants or cross-functional consultants.
Respondents: Small or Large Companies?
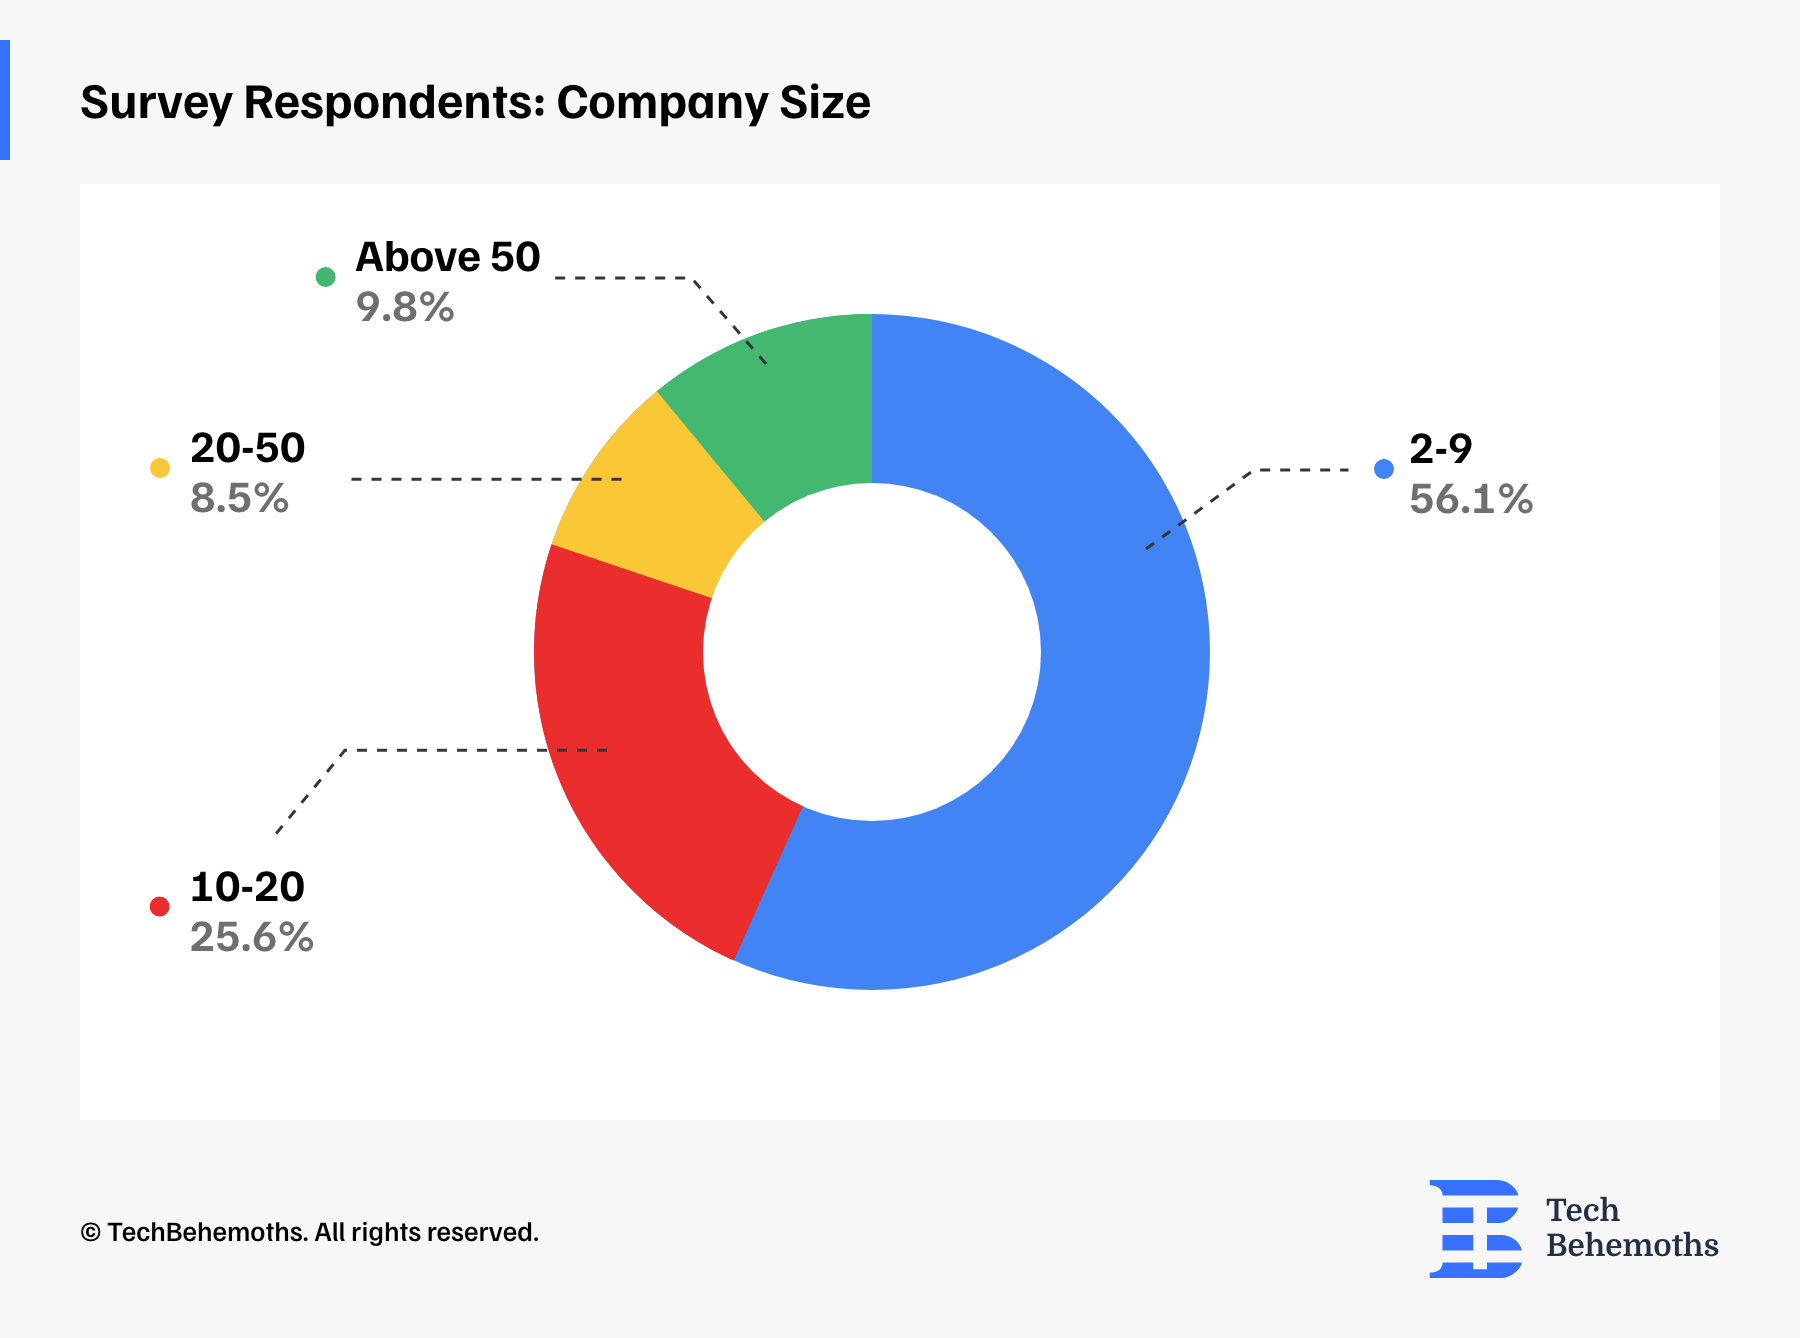
Most of the respondents work in small companies. 56.1% come from companies with 2 to 9 employees. Next, 25.6% of respondents are from companies with 10 to 20 employees, and 8.5% work in organizations with 20 to 50 employees. Only 9.8% are from larger companies with more than 50 employees. Thus, the survey mainly reflects the perspectives of small to mid-sized businesses.
What Industries Do Respondents Represent?
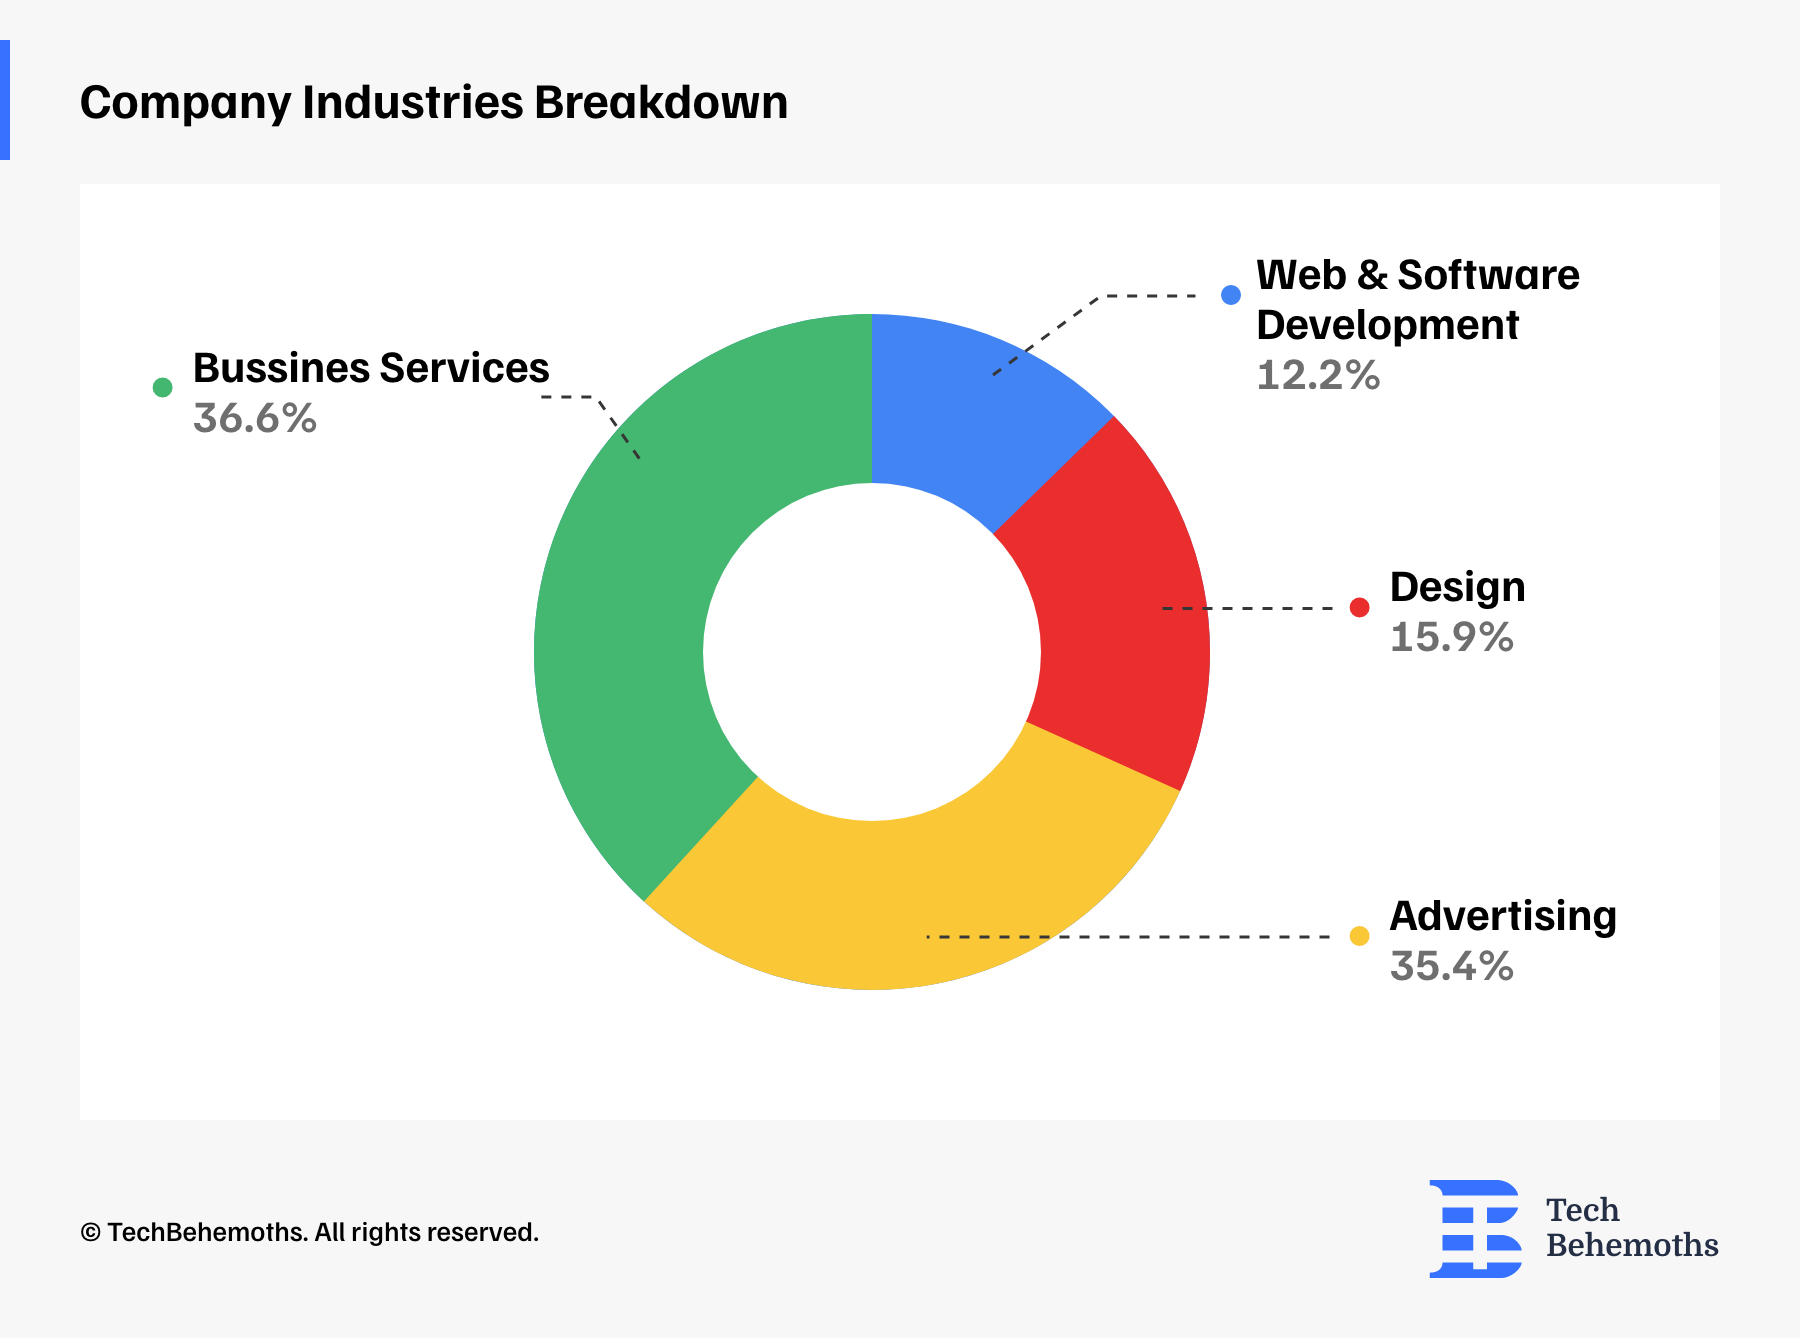
The majority of companies that participated in the survey come from the business services (39.5%) and advertising (38.2%) sectors. Next, design companies represent 17.1% of respondents, bringing creative perspectives to the survey results. Finally, Web and Software Development companies represent 13.2% of responses. This shows that the survey results focus on professionals who work closely with clients, campaigns, and performance-oriented strategies.
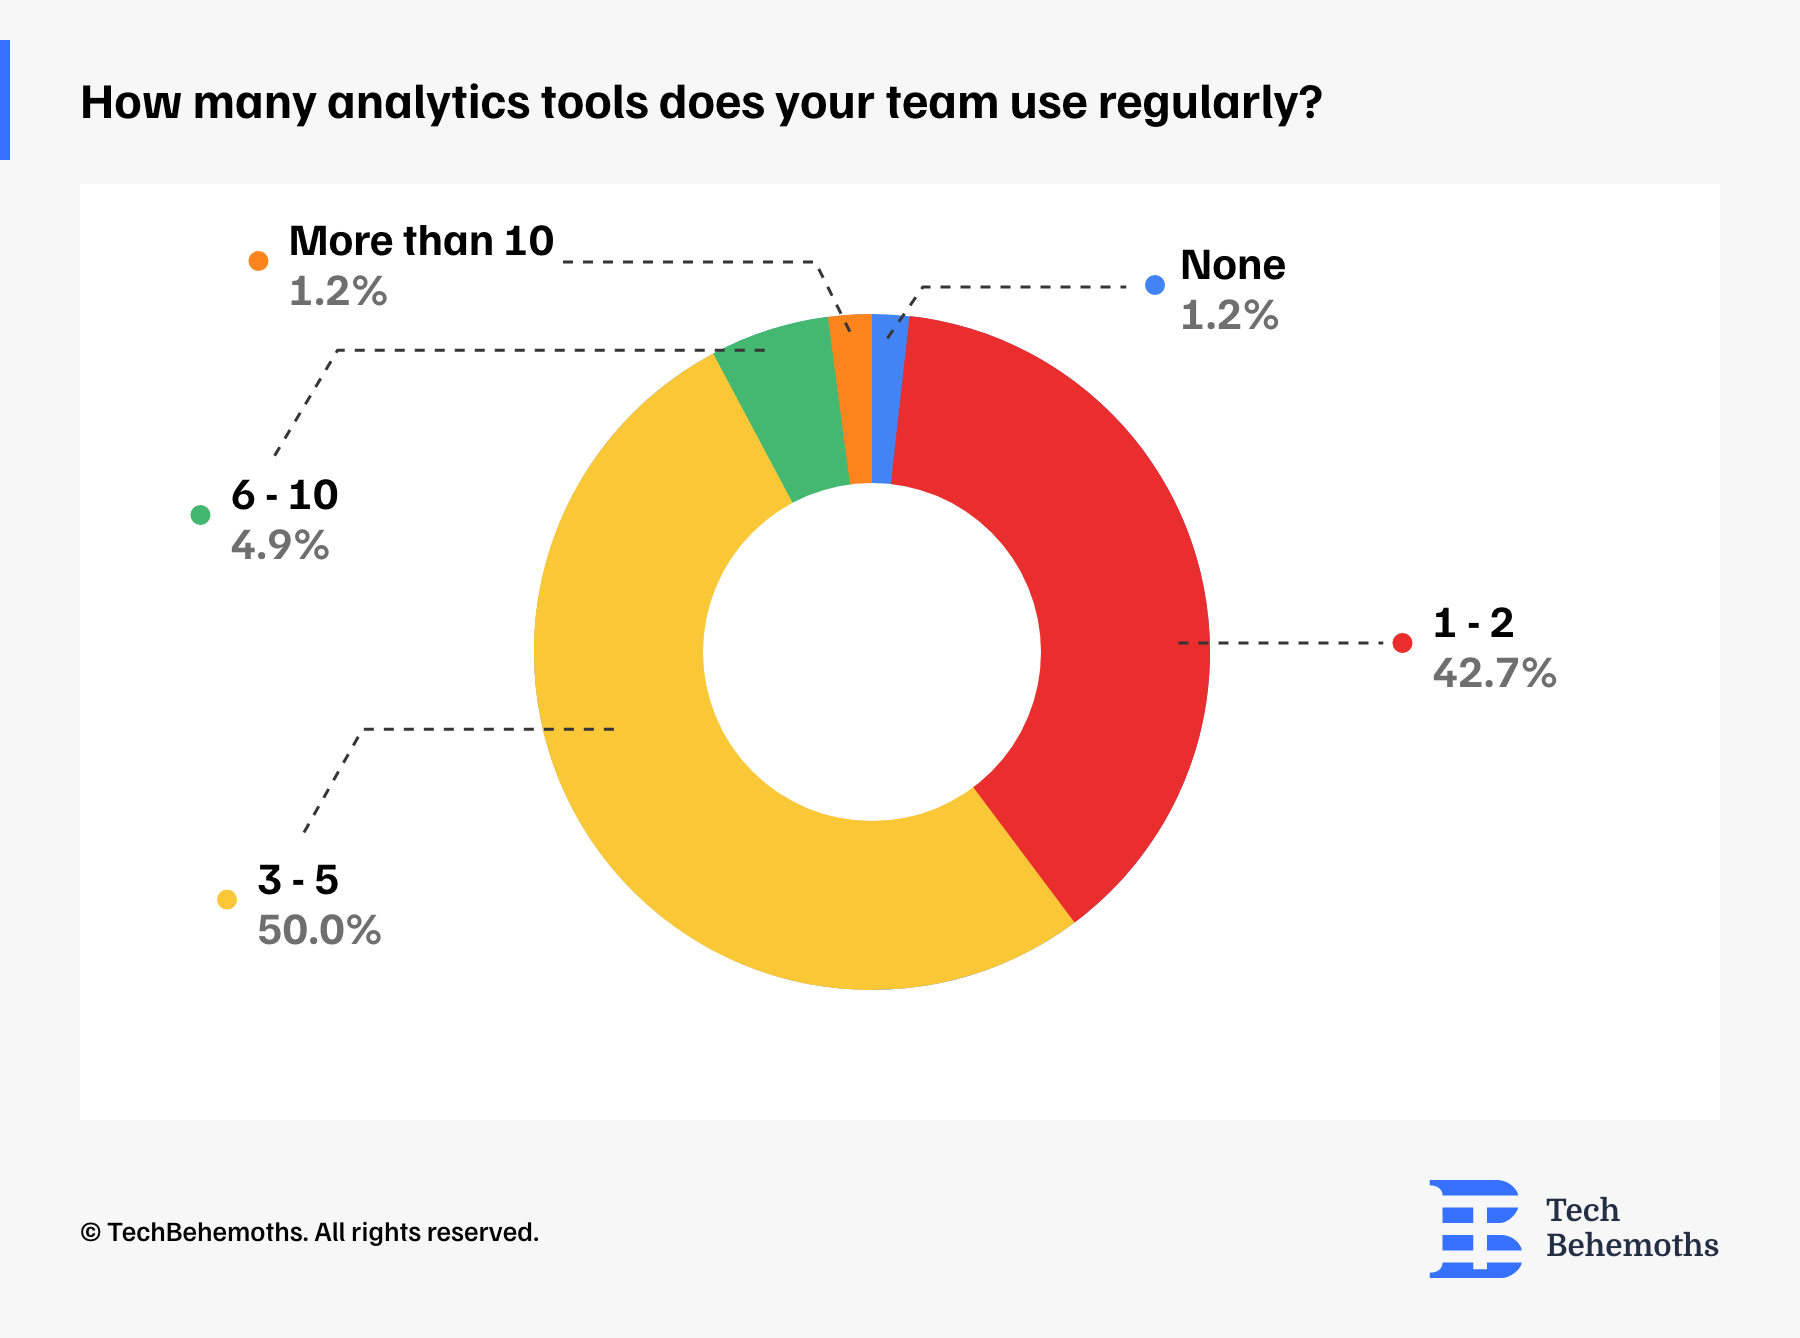
50 % of Teams Rely on 3–5 Analytics Tools
When asked how many analytics tools the survey respondents' team uses, half of them (50.0%) reported using between 3 and 5 analytics tools. 42.7% of teams said they use 1 to 2 tools, and a small group (5.3%) uses 6 to 10 tools. Interestingly, only one team (1.3%) uses more than 10 tools, and only one respondent (1.3%) does not use analytics tools at all. Accordingly, most teams rely on a small but varied set of analytics tools, typically between one and five, which speaks about their balanced approach to data without adding too much complexity.
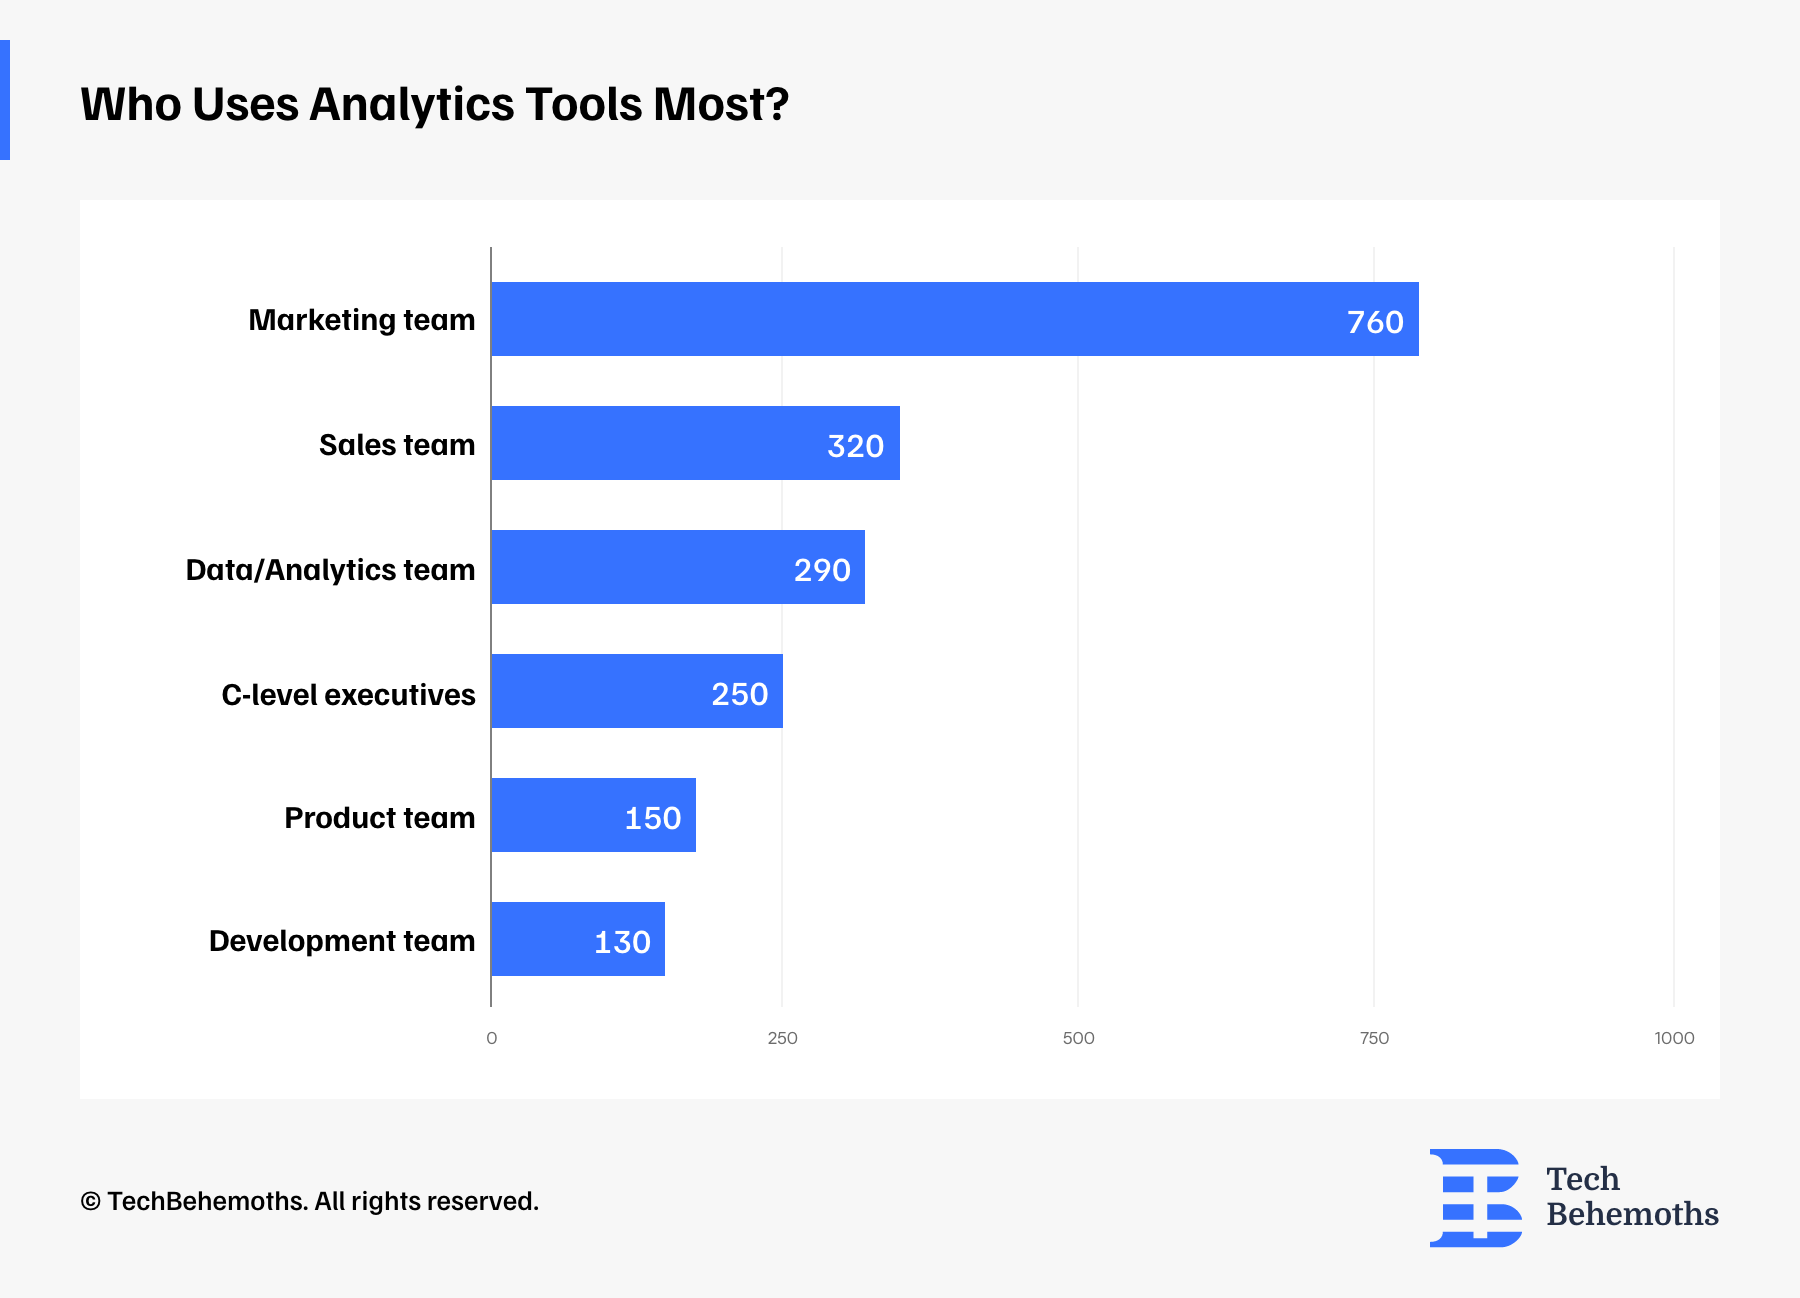
Who Uses Analytics Tools the Most?
Unsurprisingly, the Marketing team leads the way, with 760 mentions, showing that analytics is important for campaign performance, SEO, and audience insights.
They’re followed by the Sales team (320 mentions) and the Data/Analytics team (290 mentions), both of which rely on data for decision-making, forecasting, and tracking performance.
C-level executives come next with 250 mentions, indicating that leaders are actively involved with analytics.
Last but not least, product teams (150 mentions) and development teams (130 mentions) round out the list, using analytics less frequently. However, data-driven decisions still help optimize products and ensure the success of features.
Seeing that analytics is no longer reserved for data teams is gratifying. It is now a shared responsibility across departments.
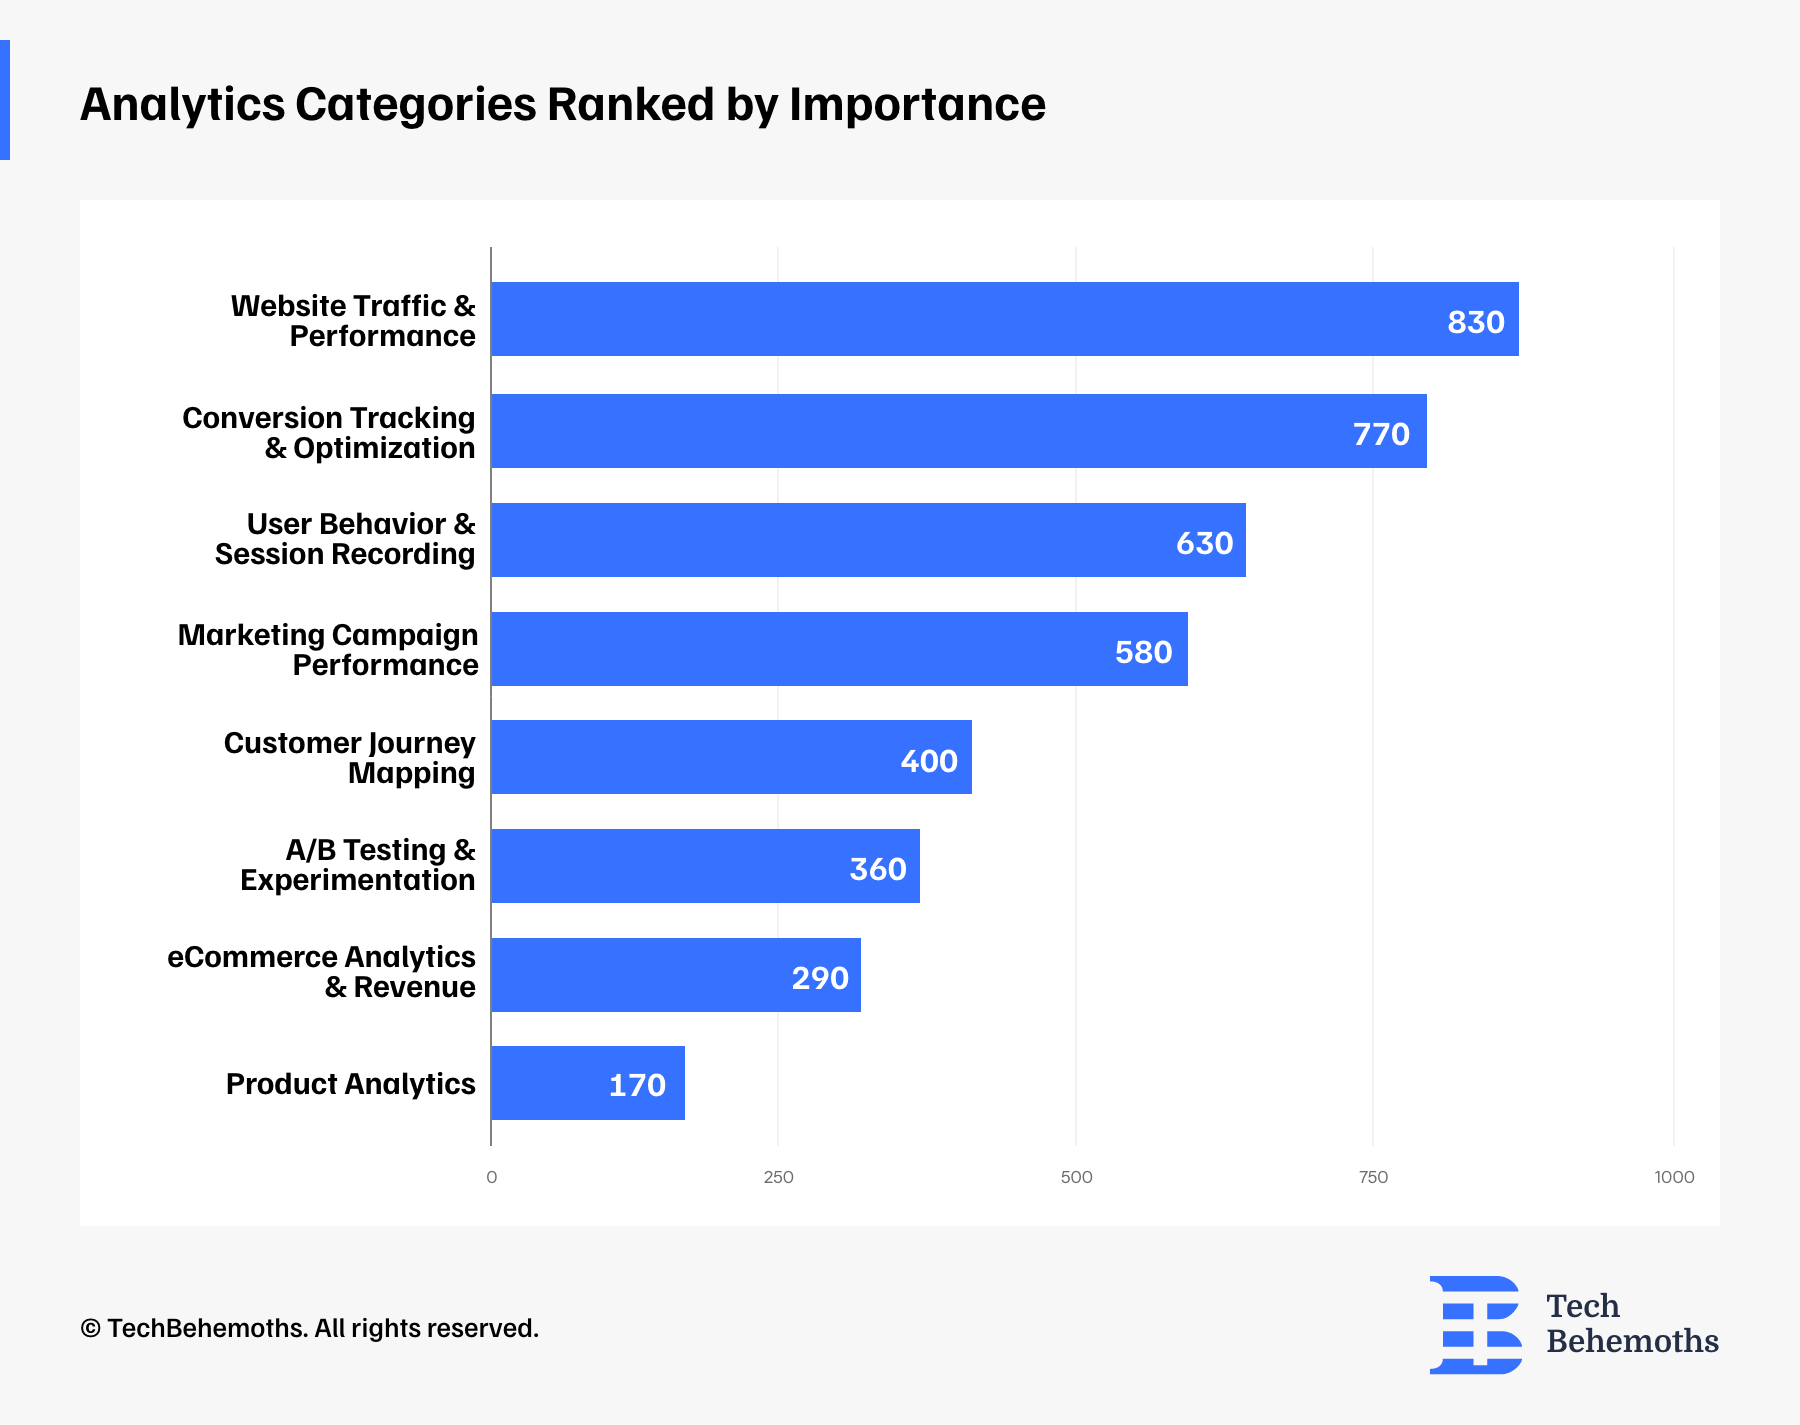
Which Analytics Categories Matter Most?
Survey data reveals that when it comes to analytics, teams prioritize five categories that improve visibility, performance, and growth.
Here’s how these different categories rank in importance, based on survey responses:
- Website Traffic & Performance tops the list, being the foundation of most analytics efforts, as it helps companies understand how users find, engage with, and convert on their websites.
- Conversion Tracking & Optimization is next, focusing on transforming visitors into leads or customers.
- User Behavior & Session Recording ranks third, offering insights into how users interact with a website or product in real time.
- Marketing Campaign Performance follows closely, pointing out the importance of measuring return on investment (ROI) and campaign success across various channels.
- Both Customer Journey Mapping and A/B Testing are also important, as they assist their teams in improving user experiences and evaluating changes.
- At the bottom of the list are Ecommerce Analytics & Revenue and Product Analytics, indicating these areas may be more niche, depending on business models, or considered lower priorities by many.
Therefore, traffic and conversion insights remain the core of analytics strategies, while tools like A/B testing and product analytics are used as needed.
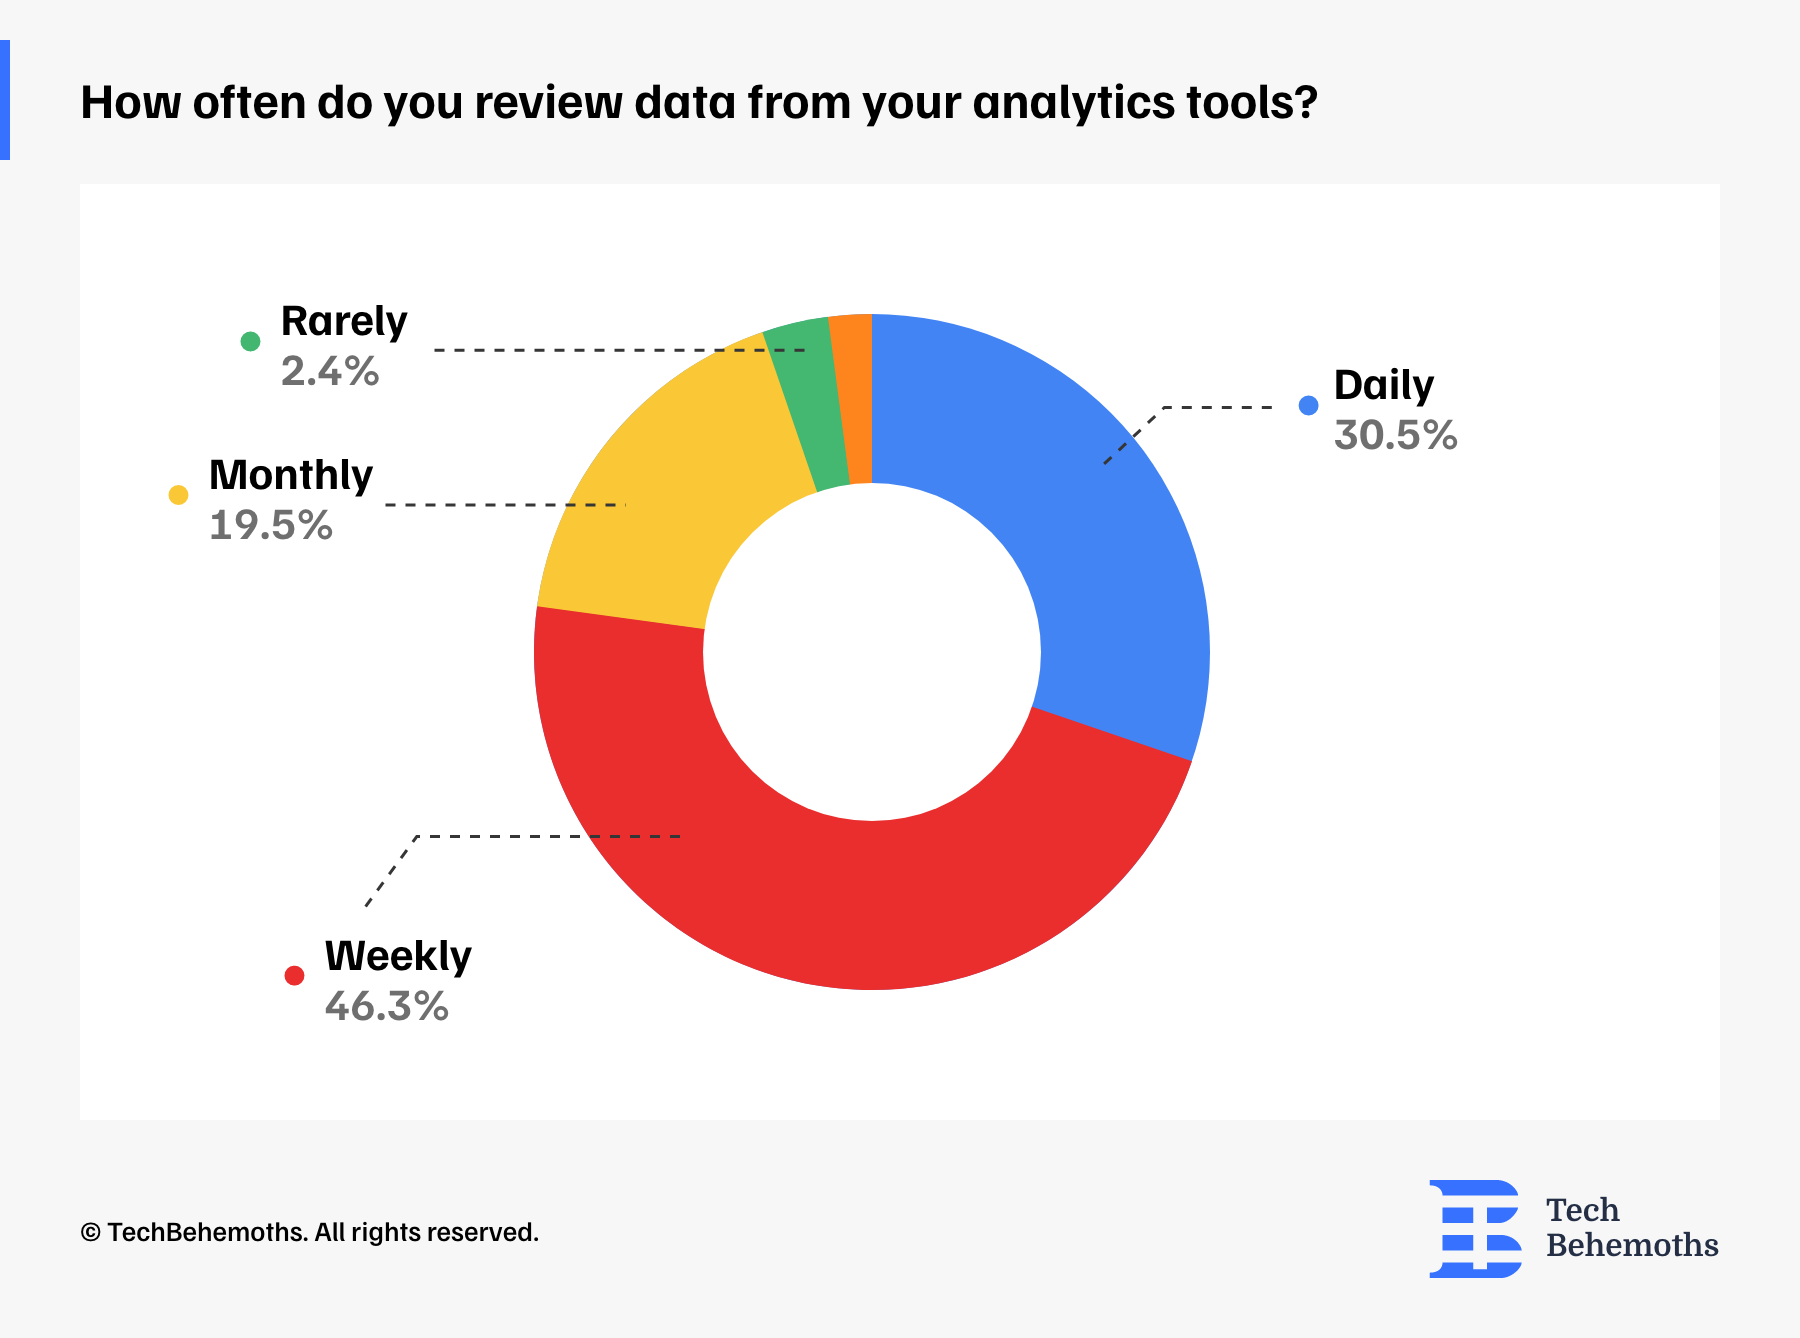
How Often Do Teams Review Their Analytics Data?
When asked about how often they use analytics, 50% of respondents told us they monitor analytics tools weekly, while 30.5% check their data daily. These results highlight a strong commitment and accountability to monitor progress in real-time or near-real-time.19.5% check data monthly, and only a very small percentage, 2.4%, 2 respondents said they rarely check analytics, and 1 team admitted they never do so. So, over 80% of teams review their analytics at least once a week, proving that constant data monitoring has become a key part of their digital operations.
Do Teams Use a Dedicated Marketing Dashboard?
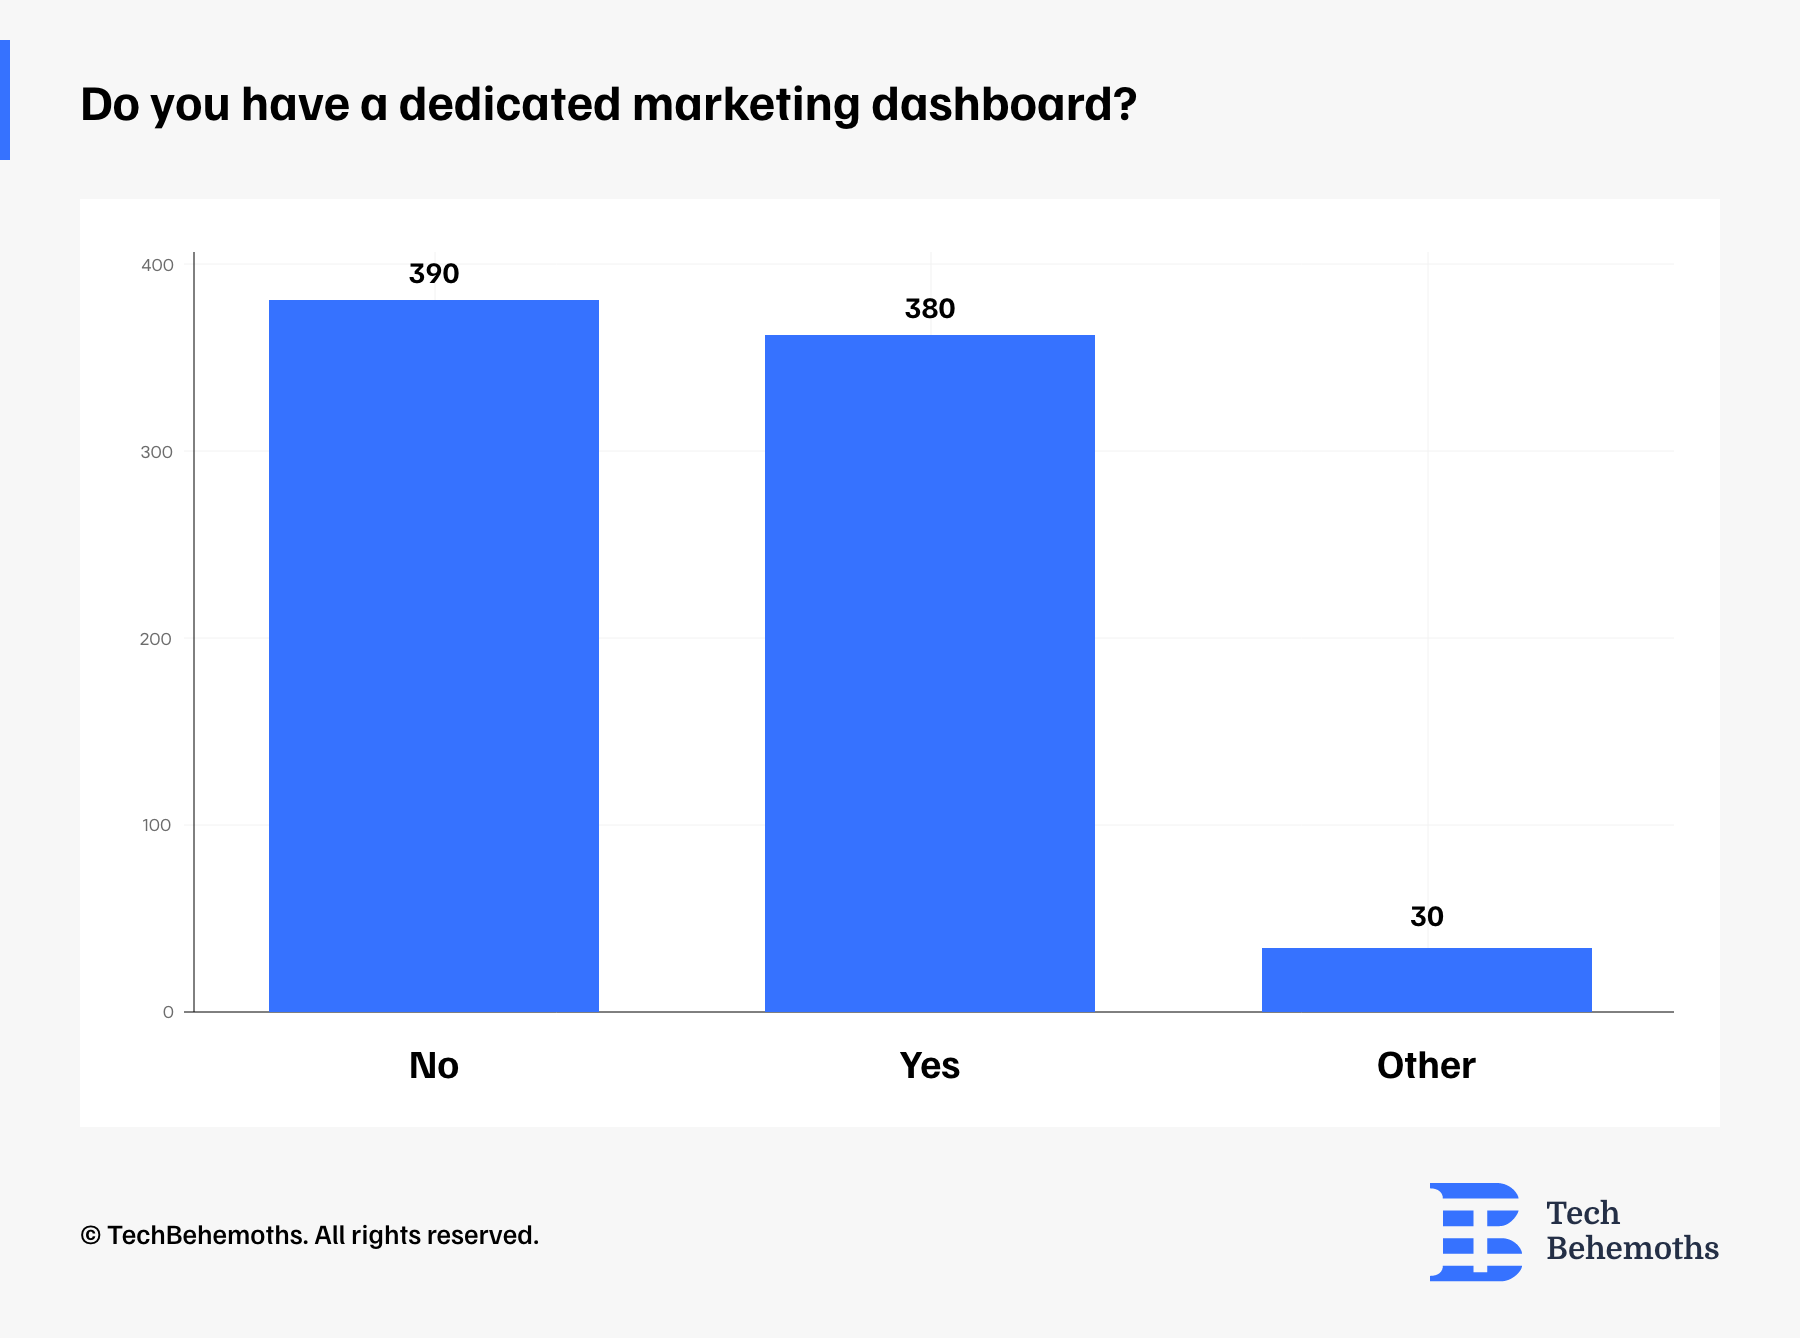
The survey data shows a nearly even split, with a small majority (390 respondents - 48.8%) saying they don't have a dedicated marketing dashboard, while 380 teams - 47.5% reported having one implemented. This result indicates that although dashboards are common, they are not yet universal.
Another 30 responses fall into the “Other” category, with notes like “under development,” “using Meta Business Suite,” or “basic dashboards exist,” — suggesting that many teams are in transition or relying on partial solutions.
What Tools Do Companies Use for Privacy-Compliant Tracking? CookieYes Is #1
First of all, let’s briefly understand what privacy-compliant user tracking is. It is the practice of collecting and analyzing user data in a way that fully complies with data protection laws, such as GDPR (the EU General Data Protection Regulation), CCPA (the California Consumer Privacy Act), and other regional privacy regulations.
This type of tracking ensures that users are informed about what data is being collected (for example, through cookie banners or privacy notices). The data is stored and managed securely, respecting legal transparency requirements and user rights. To do this properly, companies use tools.
According to our survey, the most popular and accessible solution is CookieYes, which leads the list, with 28.6% using it. Followed by Cookiebot and Cookie Information on par with 15.7% respondents each.
Larger companies, 8.6%, opt for OneTrust, Iubenda (7.1%), Termly (5.7%) and CookieScript (4.3%) are also used, responding to different regional needs and business sizes. Usercentrics is used by 2.9% of participants, showing some adoption, but on a smaller scale.
It is important to note that 5.7% of respondents selected “Other,” suggesting custom solutions or lesser-known tools. While most companies have adopted tools to ensure compliance with privacy legislation, 5.7% said they either do not use any tools or are unsure, highlighting the need for clearer guidance and better adoption of compliance tech.
![]()
Google Analytics: Still Used by 96% of Teams
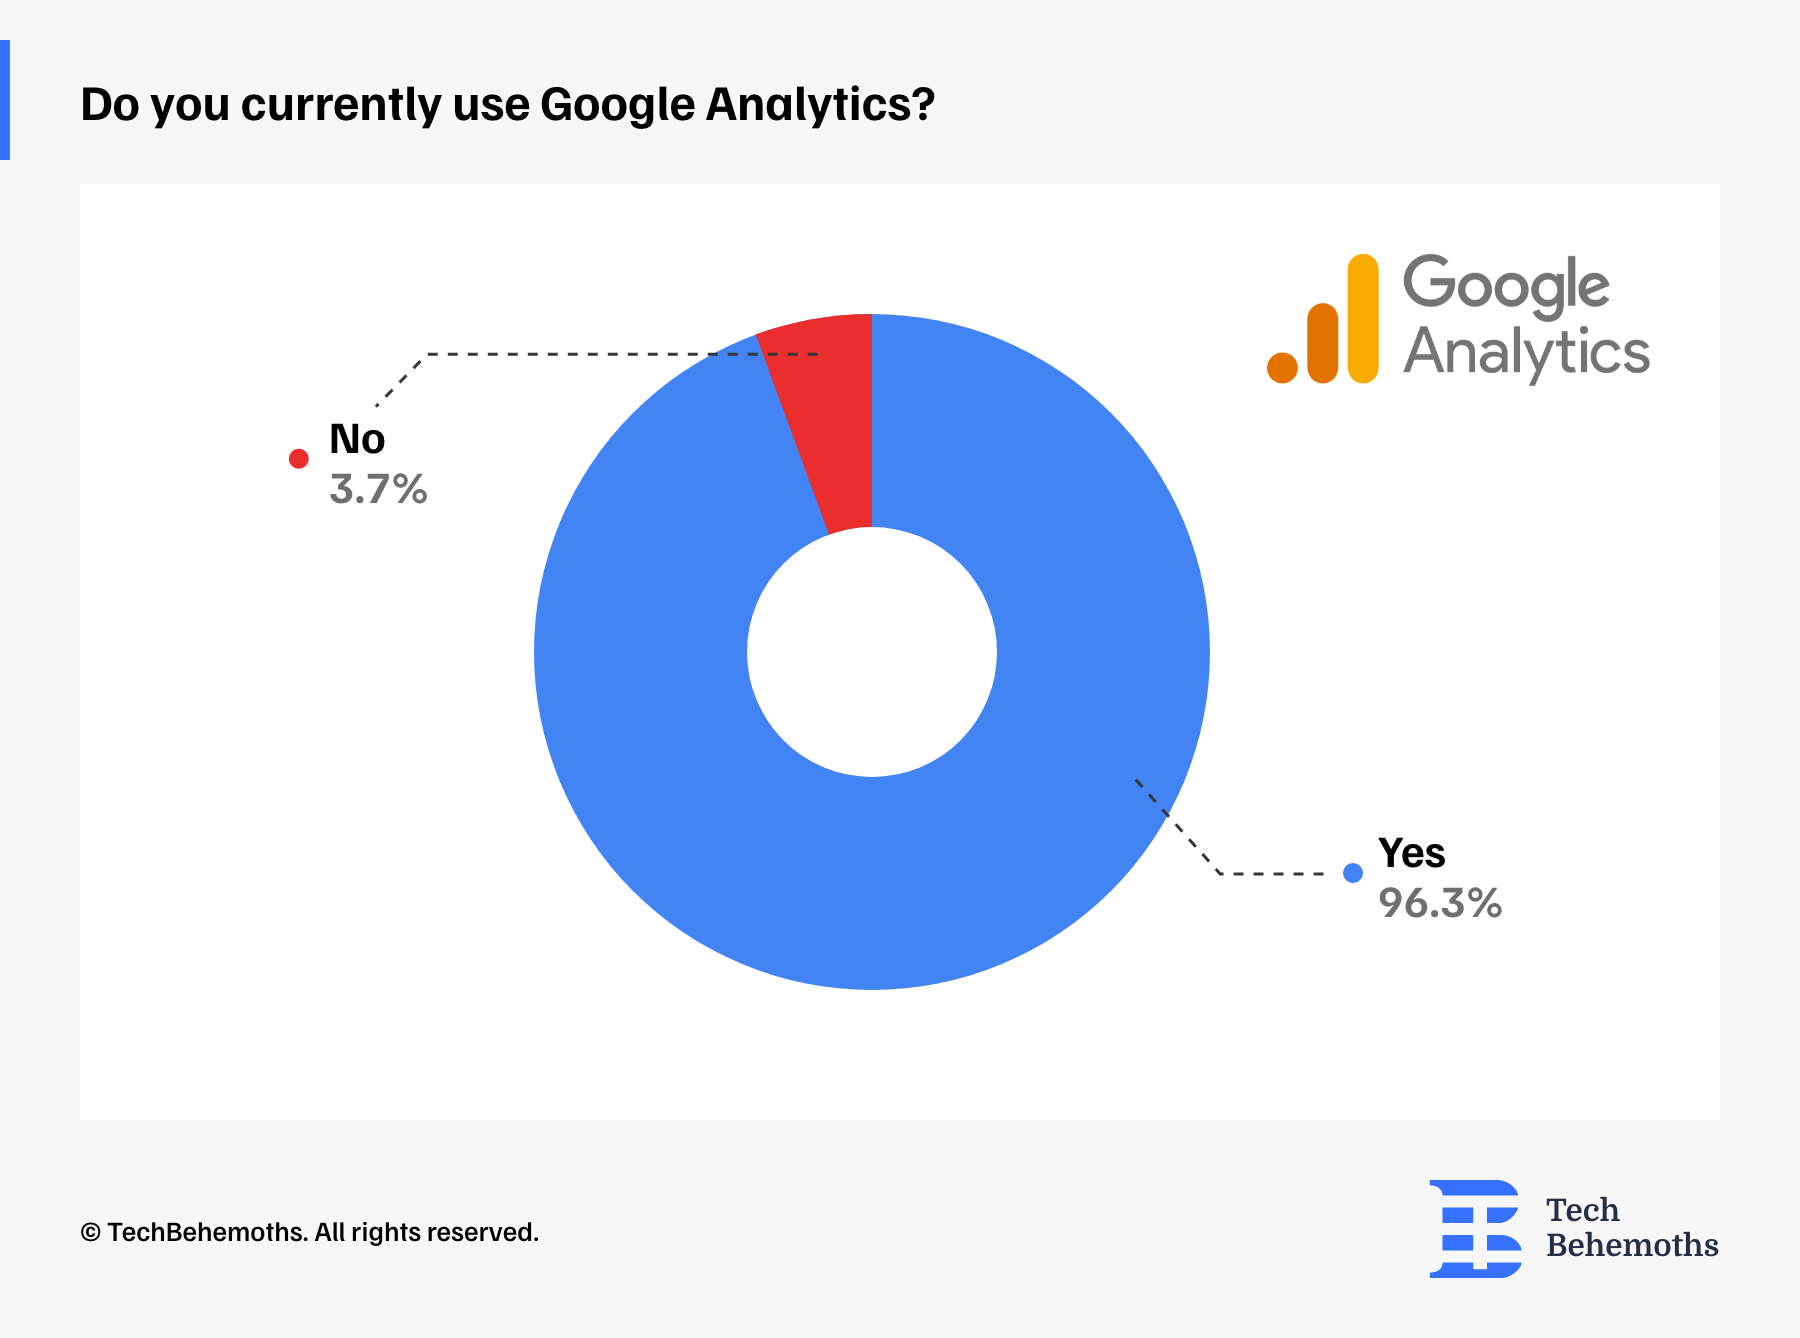
Despite growing concerns about privacy and the rise of alternatives, Google Analytics is still the default choice for nearly all teams surveyed. According to the survey data, 96.3% of the companies said they currently use Google Analytics. Only 3 respondents (3.7%) reported not using it, highlighting just how dominant Google's tool remains in the analytics space.
Which Version of Google Analytics Are Teams Using?
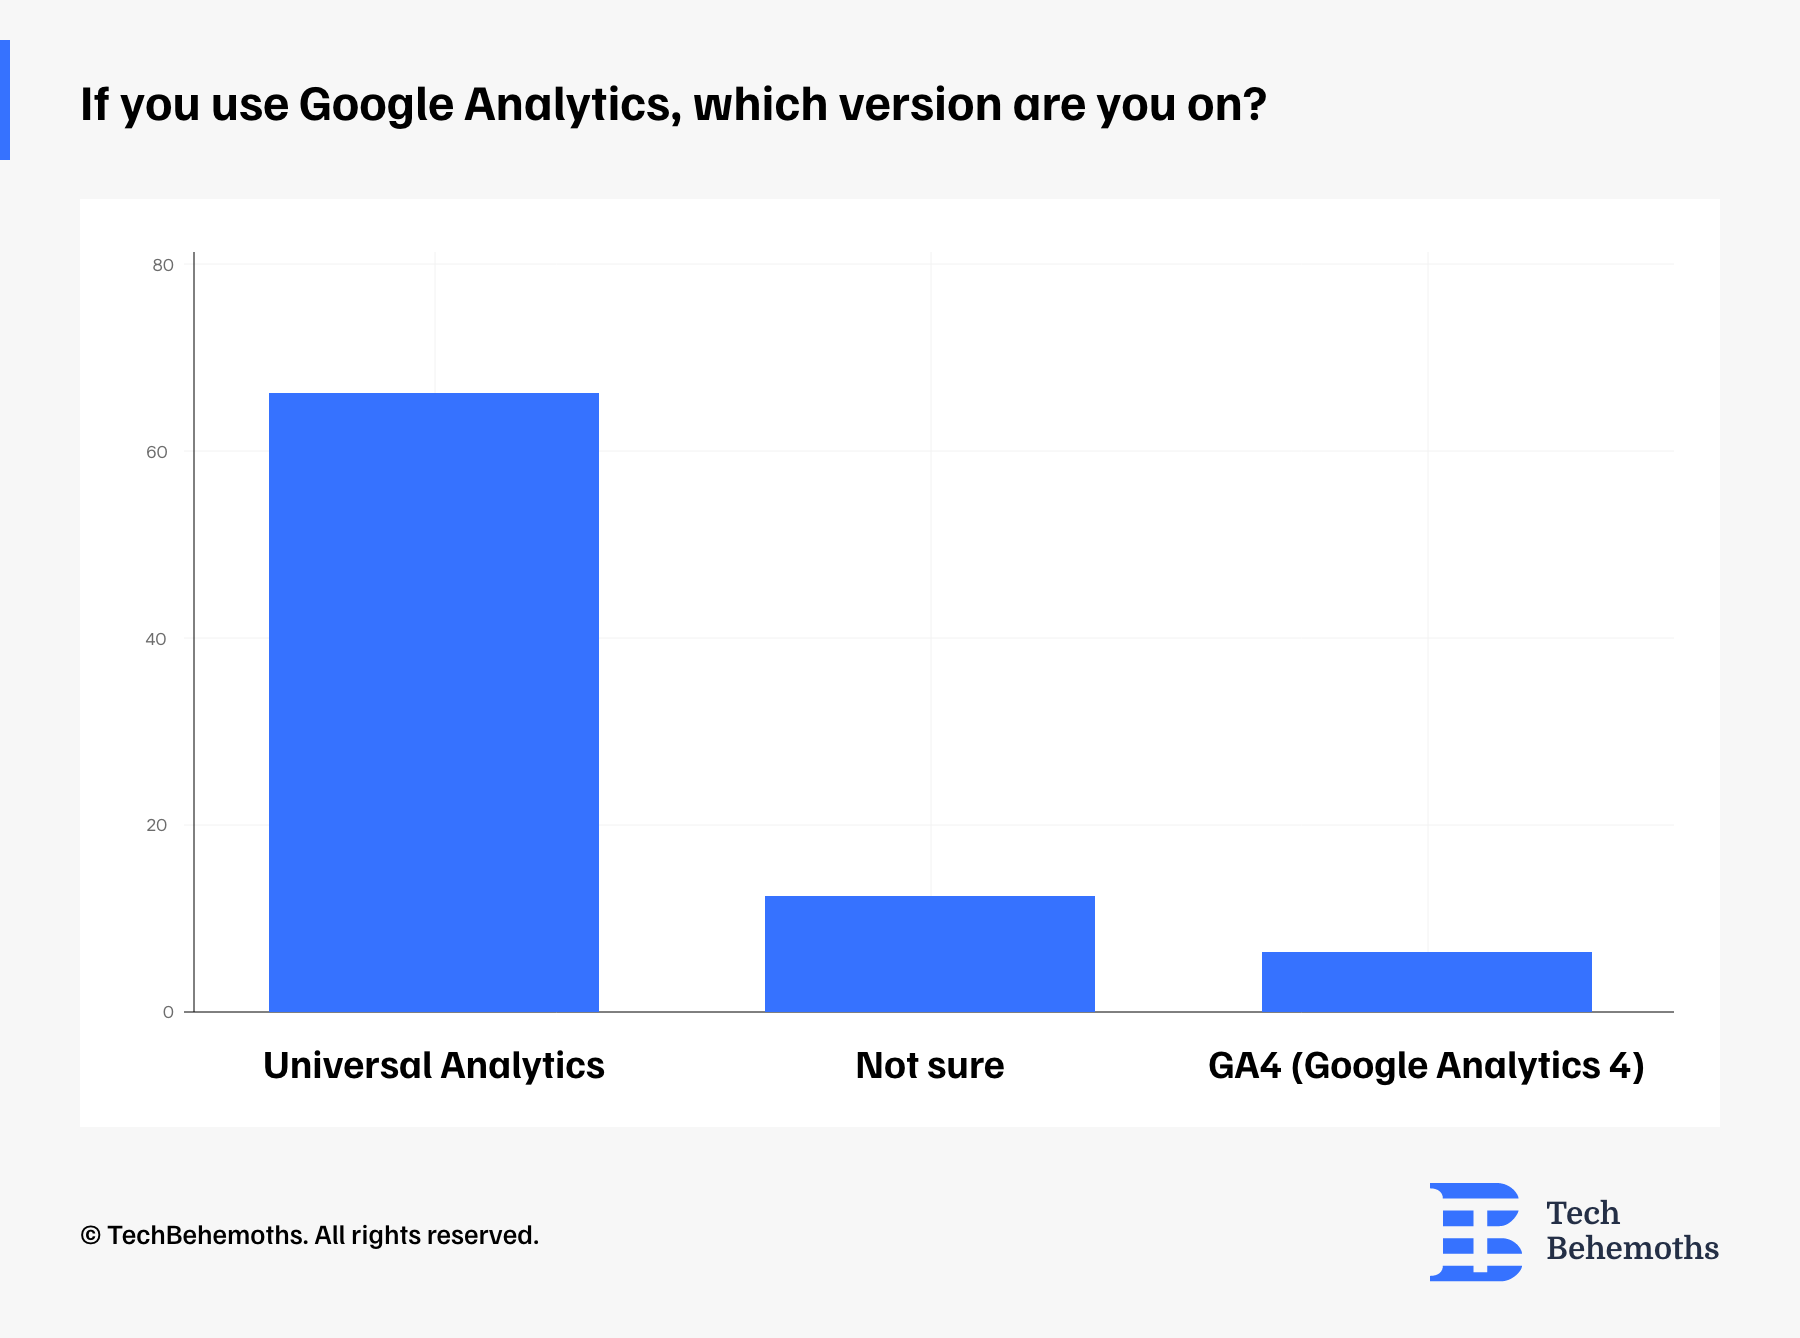
Surprisingly, the majority of teams are still using Universal Analytics. 79% of companies said they haven't moved to GA4 yet.
Only 6% reported using Google Analytics 4. Another 15% said they weren't sure which version they were using, suggesting a lack of clarity and involvement in the technical setup.
Universal Analytics remains the default for most, and many teams haven’t made the transition to GA4— or don’t even know if they have.
Why Do Teams Still Use Google Analytics?
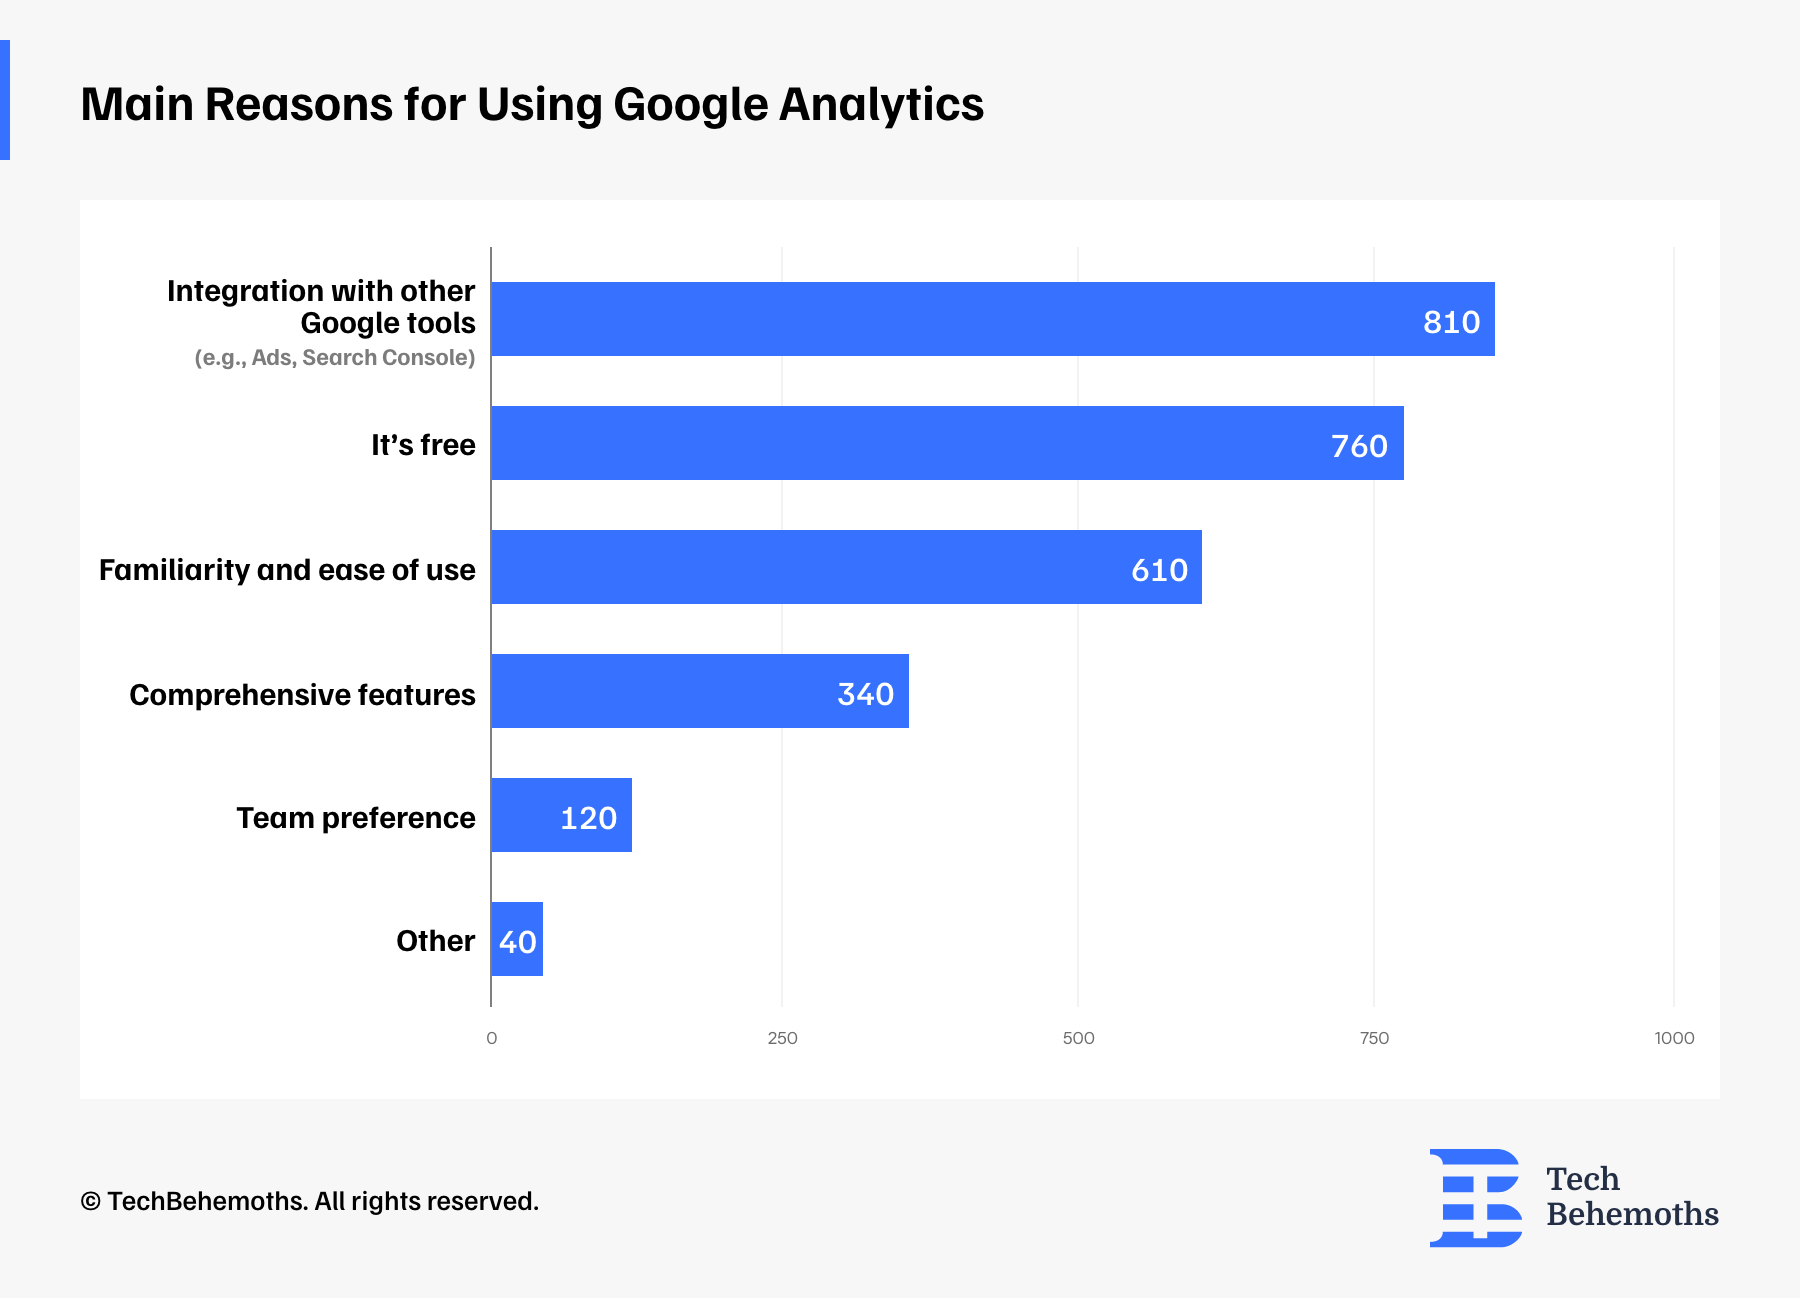
When asked why companies still use Google Analytics, the main reason was that it seamlessly integrates with Google Ads, Search Console, and other tools in the Google ecosystem, making it easier to manage and measure campaigns in one place. Another advantage is that it is free and easy to use.
Teams also prefer Google Analytics because of its ability to provide all this comprehensive data - real-time visitor tracking, detailed user behavior such as page views, bounce rates, session duration, insights into audience demographics and interests, and a clear breakdown of traffic sources (search, social, direct traffic, ads).
And finally, teams prefer this tool, as they know and trust it.
SEMrush & Ahrefs Top the List of Google Analytics Alternatives
While the survey shows that Google Analytics is at the top of the list of preferences, teams are still exploring alternative tools, whether for privacy, features, or ease of use. A few tools clearly stand out.
SEMrush tops the list with 510 mentions, thanks to its strong focus on SEO, site auditing, and traffic analytics, making it very popular among respondents. Ahrefs follows in second place with 420 users choosing it, reflecting its continued popularity for keyword tracking, backlink analysis, and competitive research.
HubSpot ranks third with 280 mentions, likely favored for its marketing automation and CRM integration alongside basic analytics. Hotjar (220) and Microsoft Clarity (210) are a short distance behind, both focusing on user behavior, heat maps, and session recordings.
Zoho Analytics (50 mentions) is gaining attention for businesses looking for customizable dashboards and business intelligence.
Other Tools (27 total) include a mix of privacy-focused platforms, niche solutions, and advanced analytics tools. These include:
-
Matomo, Mixpanel, PostHog, Kissmetrics – known for event-based or privacy-first analytics
-
Tableau, PowerBI, ELK Stack, Prometheus – used by more data-heavy or enterprise teams
-
Crazy Egg, Lucky Orange, Chartbeat, Woopra – focusing on visual behavior tracking
-
Search-focused tools like SE Ranking, Search Console, and Search Atlas
-
And a few agency-oriented platforms like AgencyAnalytics and Ubersuggest
While Google Analytics still dominates, many teams are diversifying their stack, often pairing SEO tools with behavior-focused platforms.
![]()
51.9 % Say Google Analytics Is Better Than the Rest — Only 6% Disagree
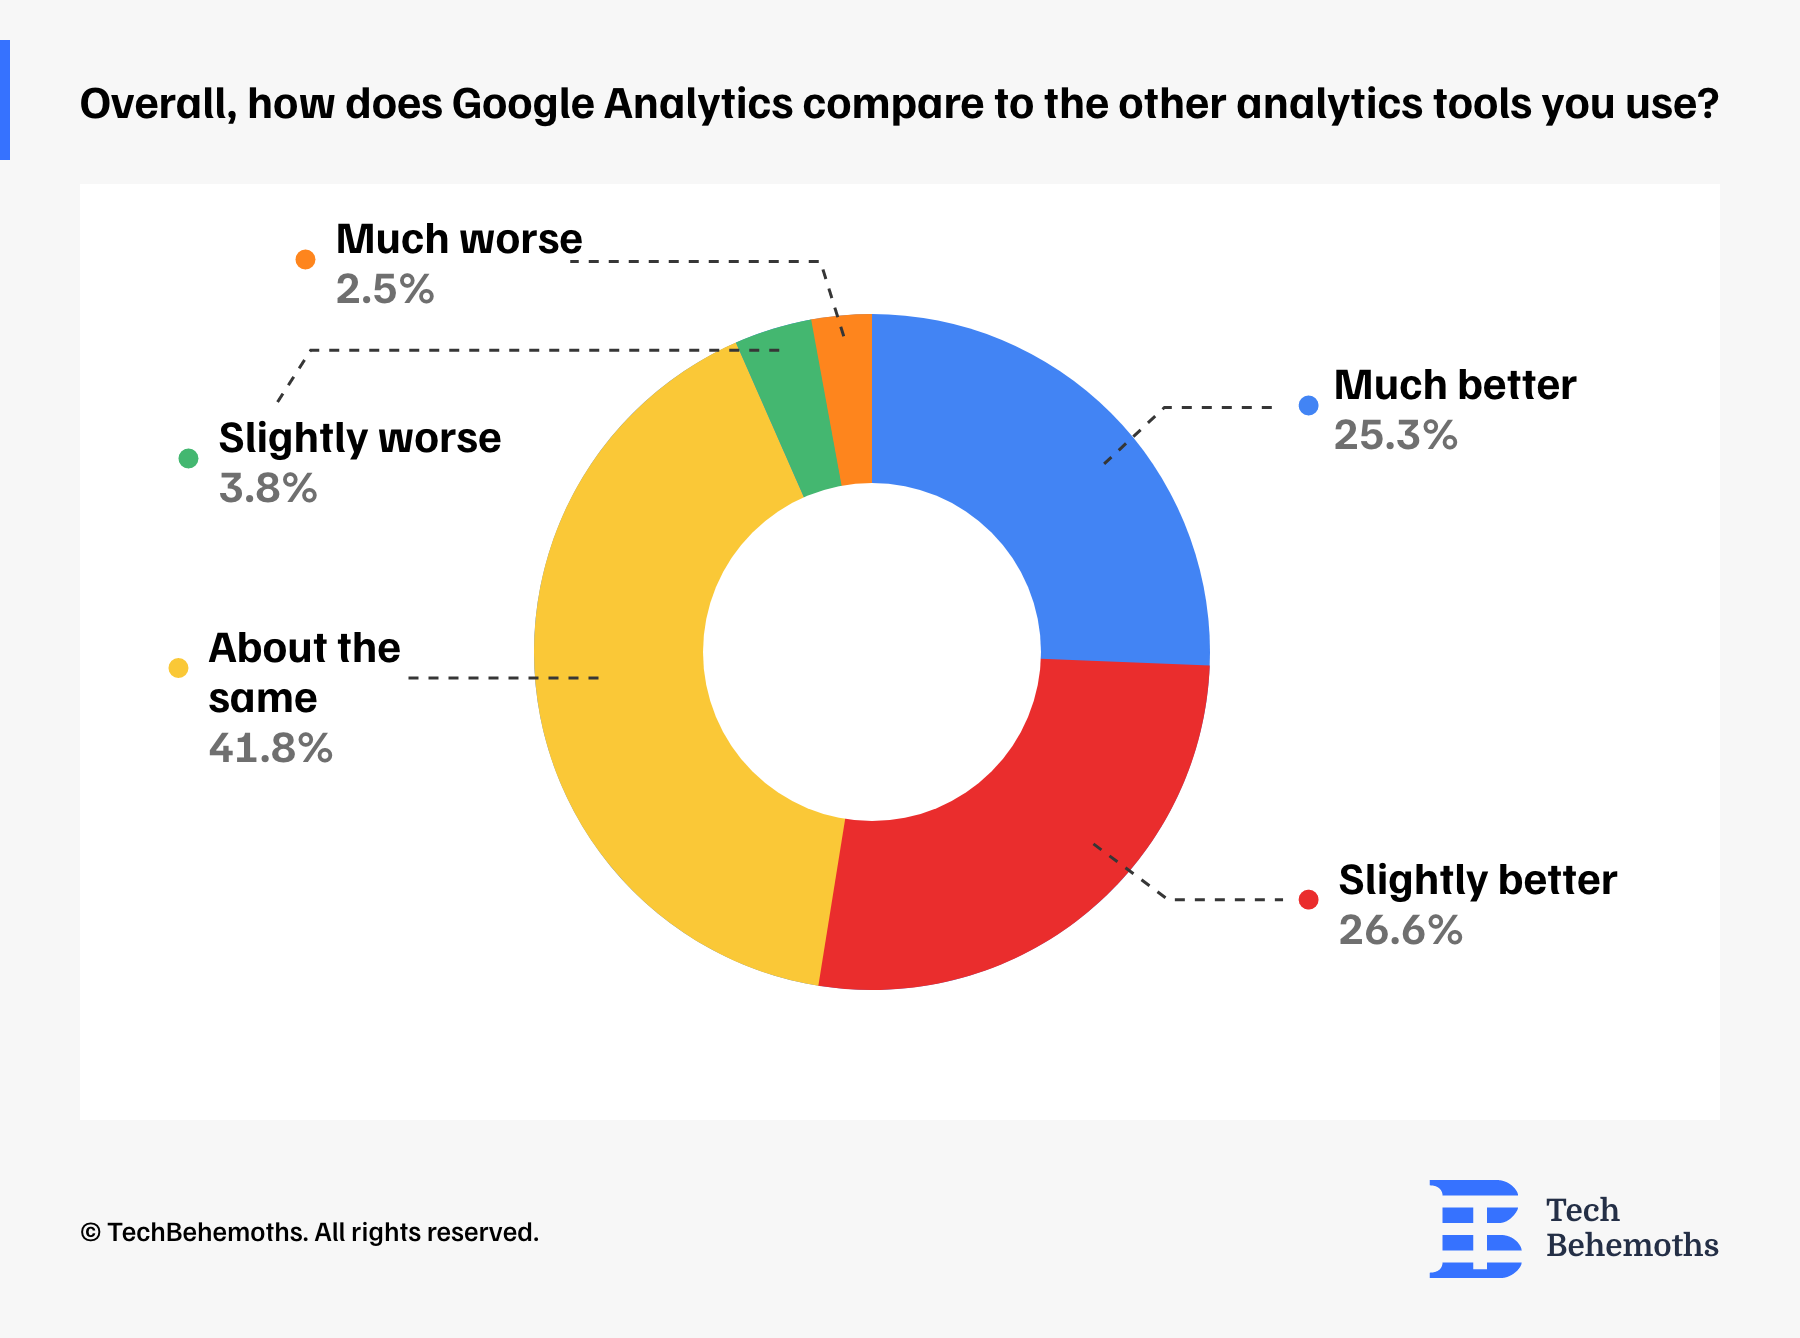
When asked how Google Analytics compares to the other analytics tools you use, over half of respondents (51.9%) believe it performs better than other tools, with 25.3% saying it’s much better and 26.6% saying it’s slightly better. 41.8% feel it’s about the same, and only a small share — 6.3% — view it as worse than other analytics tools.
Therefore, Google Analytics remains a top choice, either outperforming or matching the performance of its competitors for most users.
Use of AI Tools for Search Performance
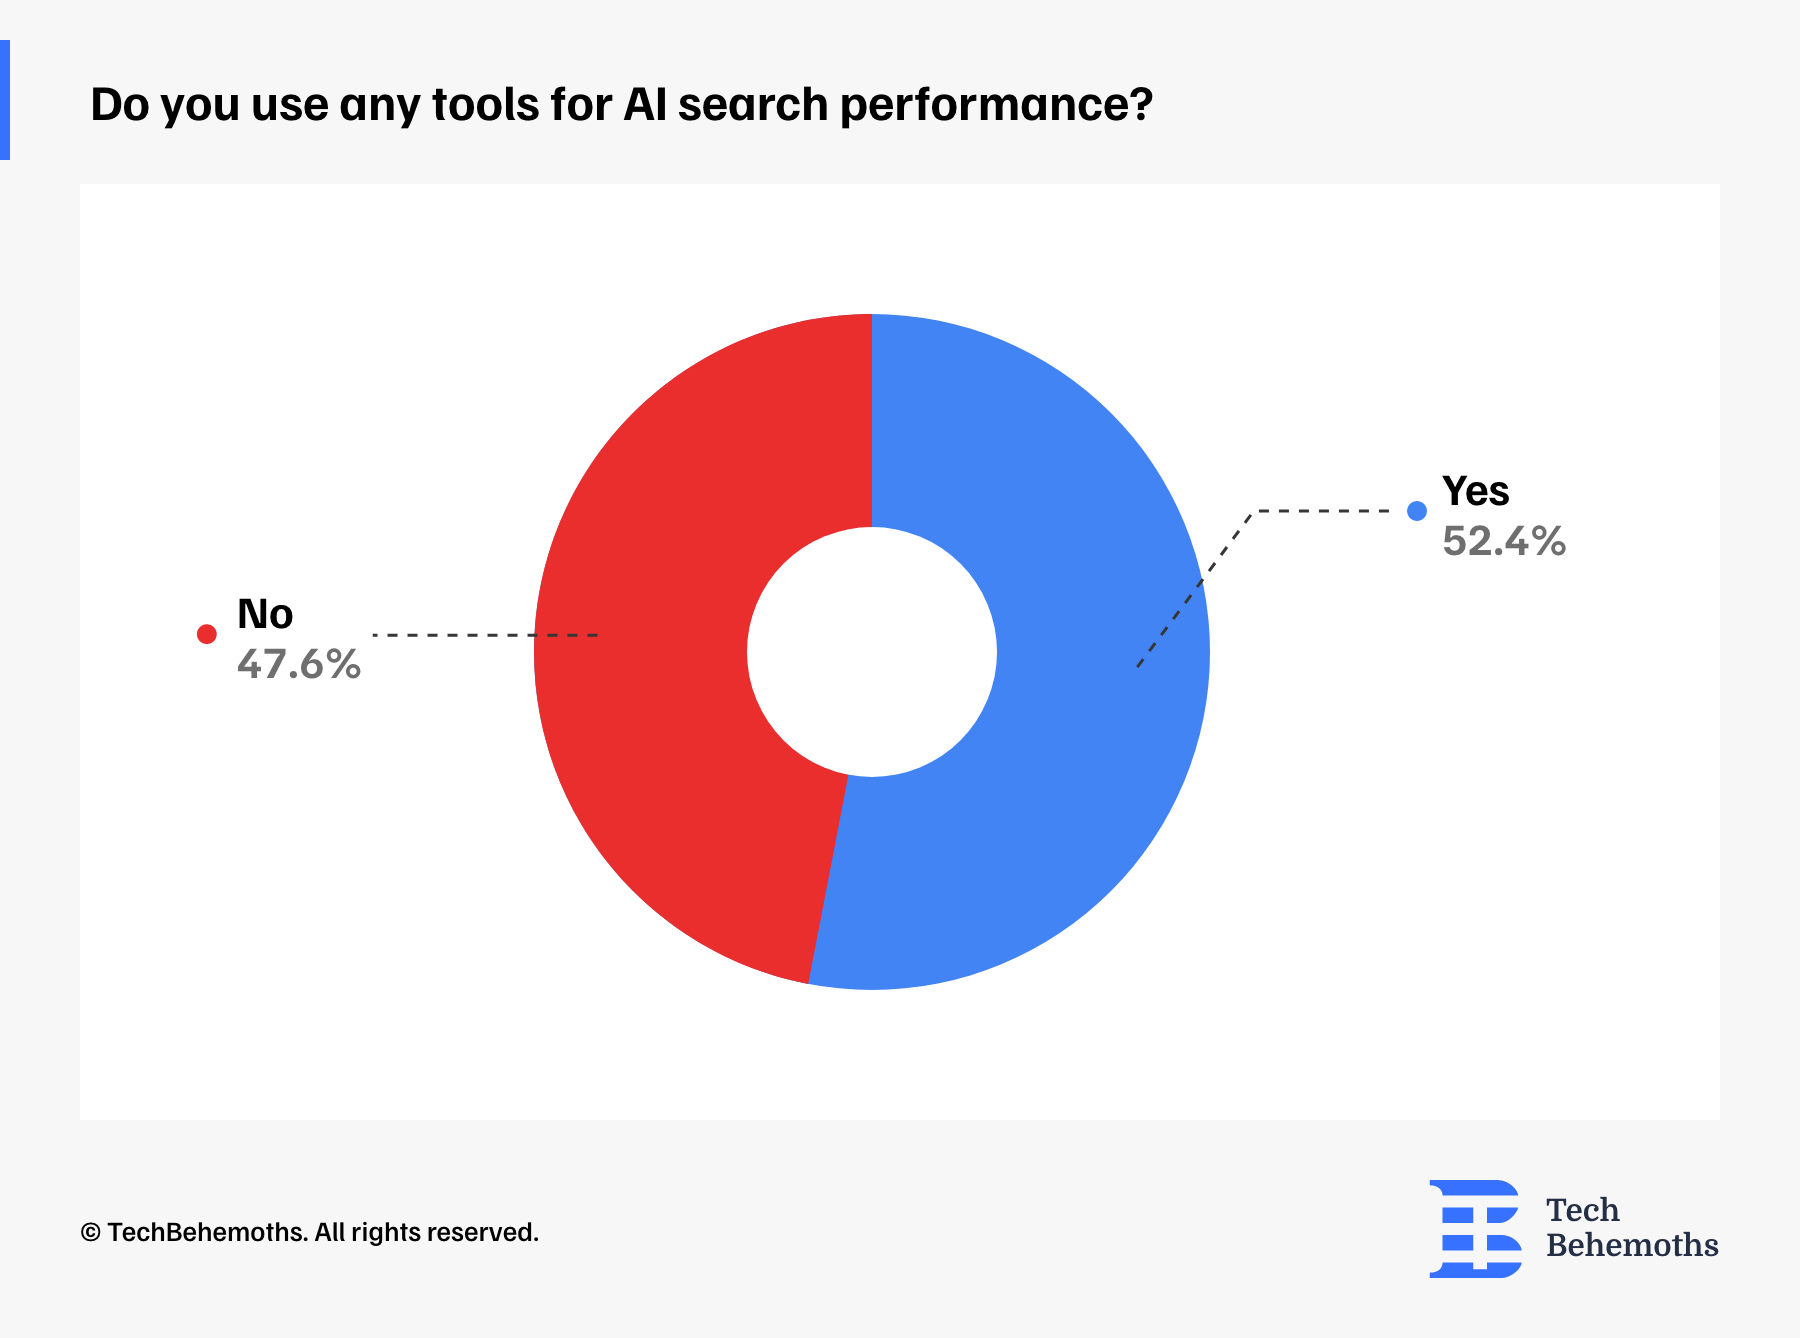
We asked respondents whether they currently use any tools to support AI-driven search performance. Accordingly, the responses were nearly evenly split:
- (52.4%) said Yes
- (47.6%) said No
Just over half of the teams surveyed are already using AI tools to improve search performance, but there’s still a significant portion yet to explore these tools.
Which Tools Are Teams Using to Track Visibility in AI Search & Chatbots?
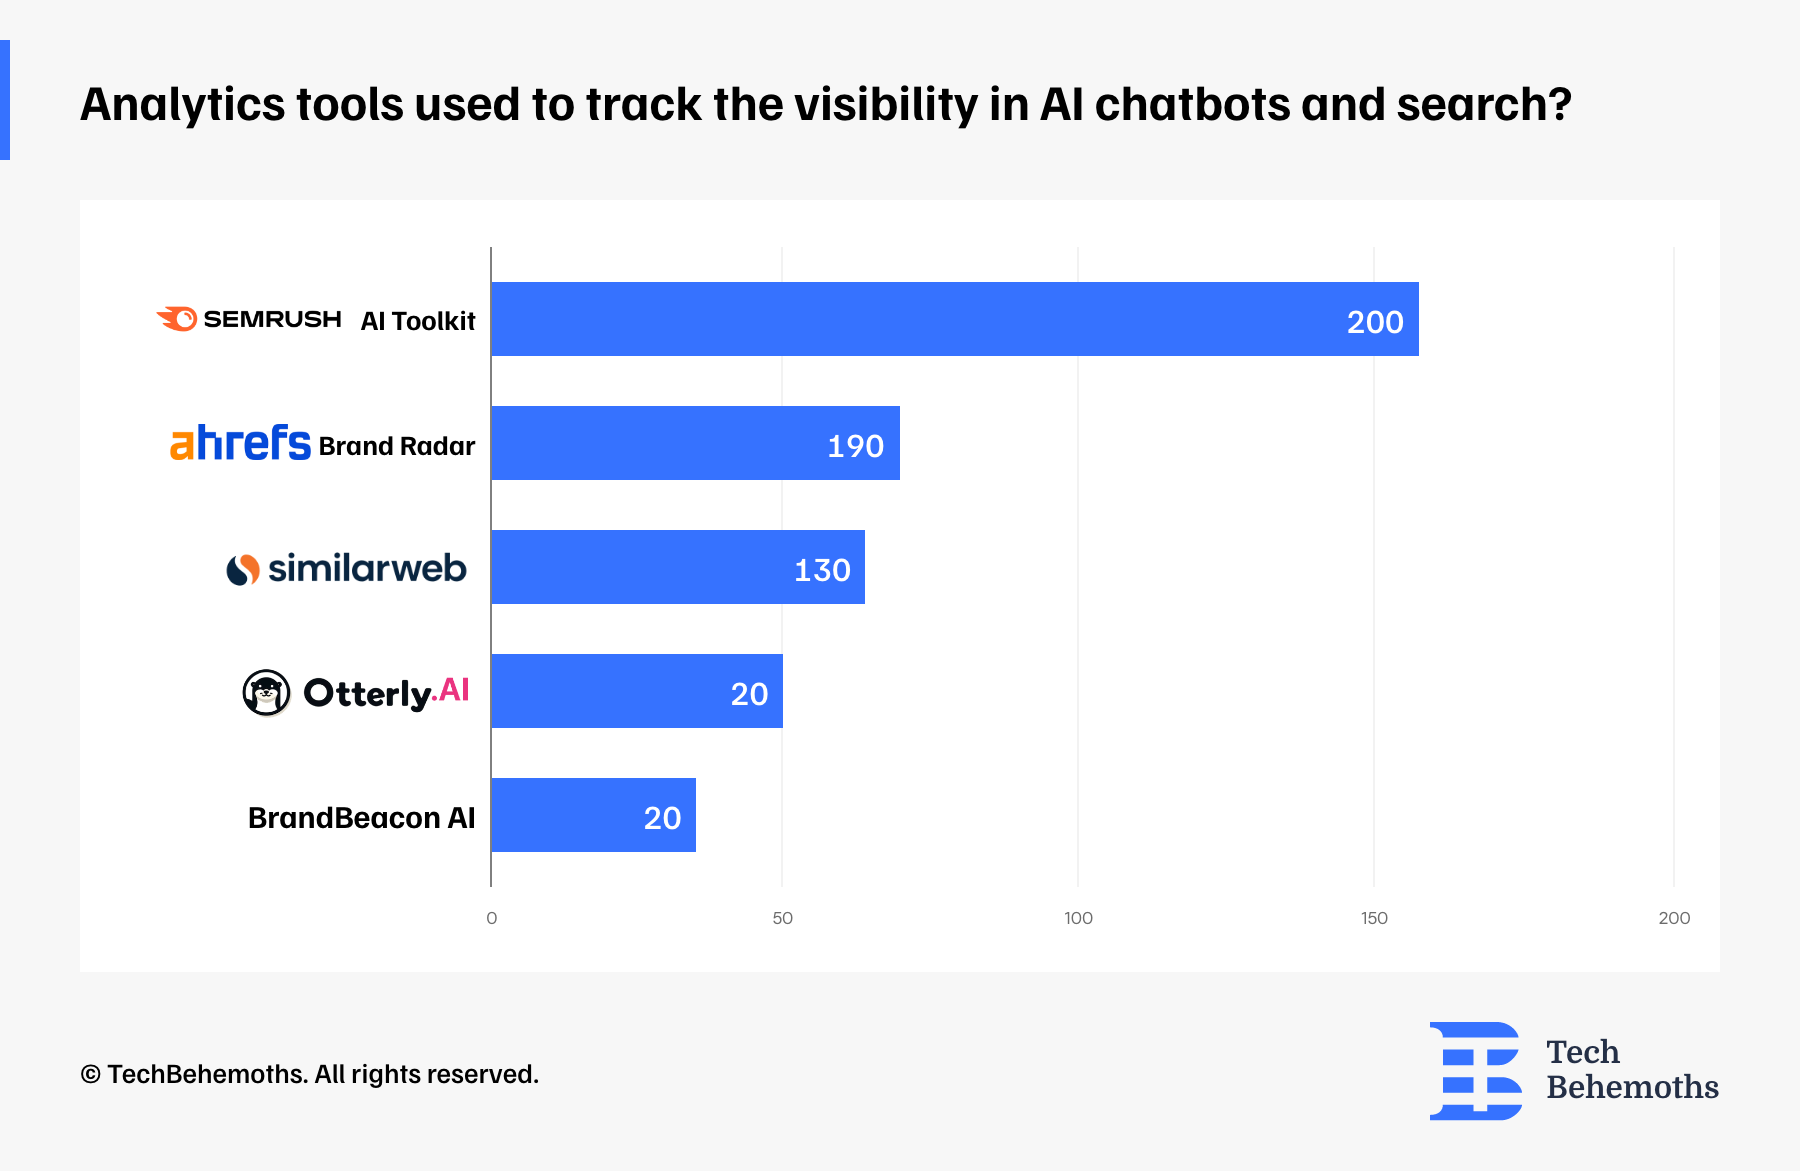
Among those who use tools for AI-driven search performance, a few platforms stand out as favorites:
-
Semrush AI Toolkit is the most popular tool, with 200 mentions, which is great for tracking brand visibility in AI-generated answers.
-
Ahrefs Brand Radar is in second place with 190 mentions, being a good option for monitoring mentions and visibility in AI summaries.
-
Similarweb is used by 130 respondents and is known for offering competitive intelligence and traffic insights, and is now expanding into AI visibility.
-
Otterly AI and BrandBeacon AI are smaller but growing tools, each used by 20 teams. They show a rising interest in specialized AI visibility tracking.
Other Tools Used for AI Search Visibility
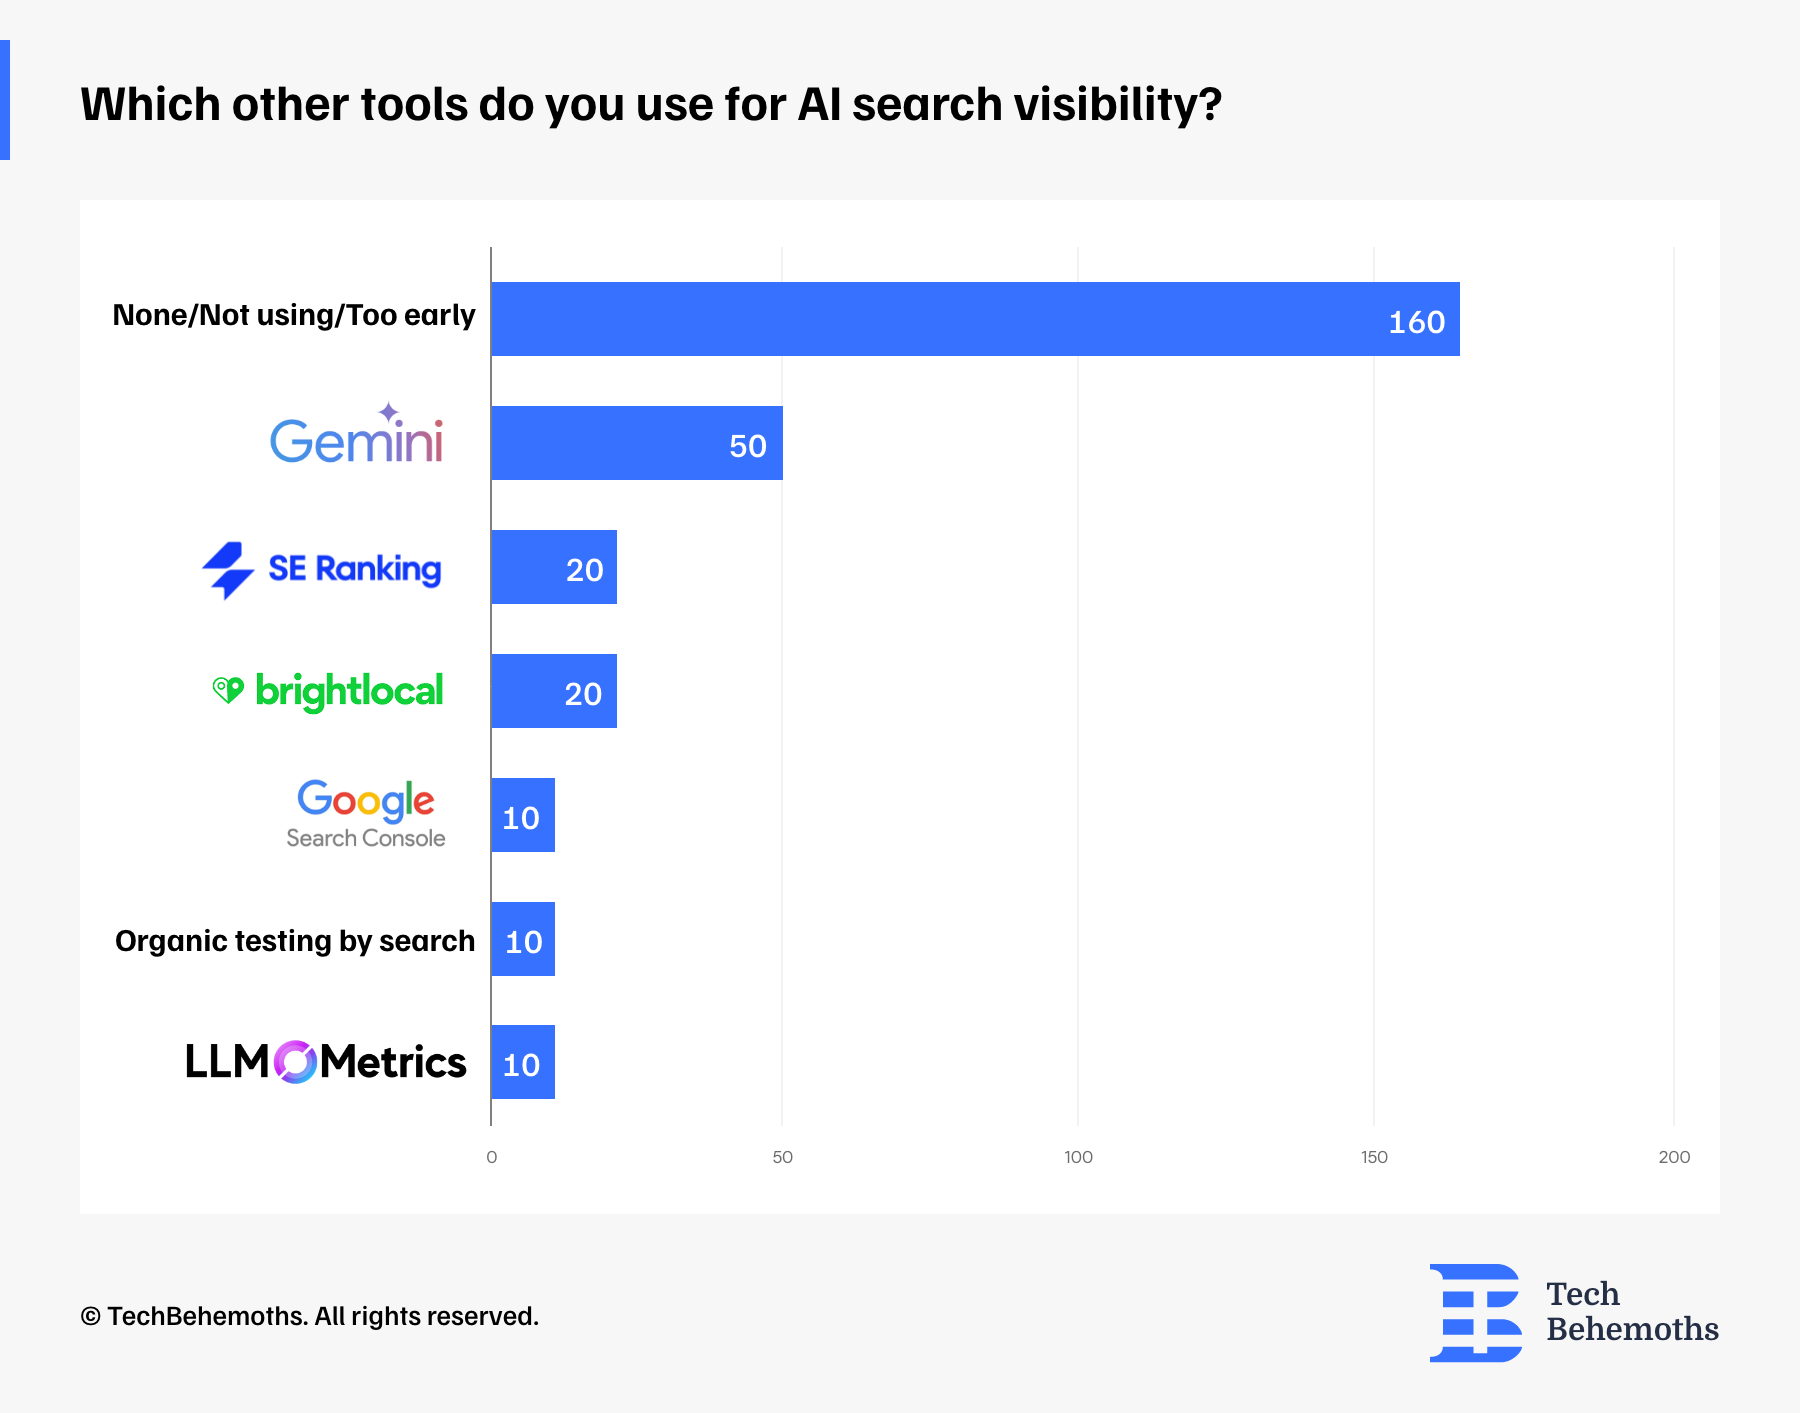
On the other side, many teams are still in the early stages of tracking AI search visibility — 160 respondents said they’re not using any tools yet or feel it’s too early.
Among those who are exploring this space, Gemini (along with ChatGPT) is the most mentioned alternative, used by 50 teams. Tools like SE Ranking and Bright Local were also cited (20 mentions each), followed by Google Search Console, organic testing, and LLMO (10 mentions each).
Adoption is still low, but interest is growing, especially around tools that support local SEO and AI-generated results.
What Are Teams Learning from AI Search Tools?
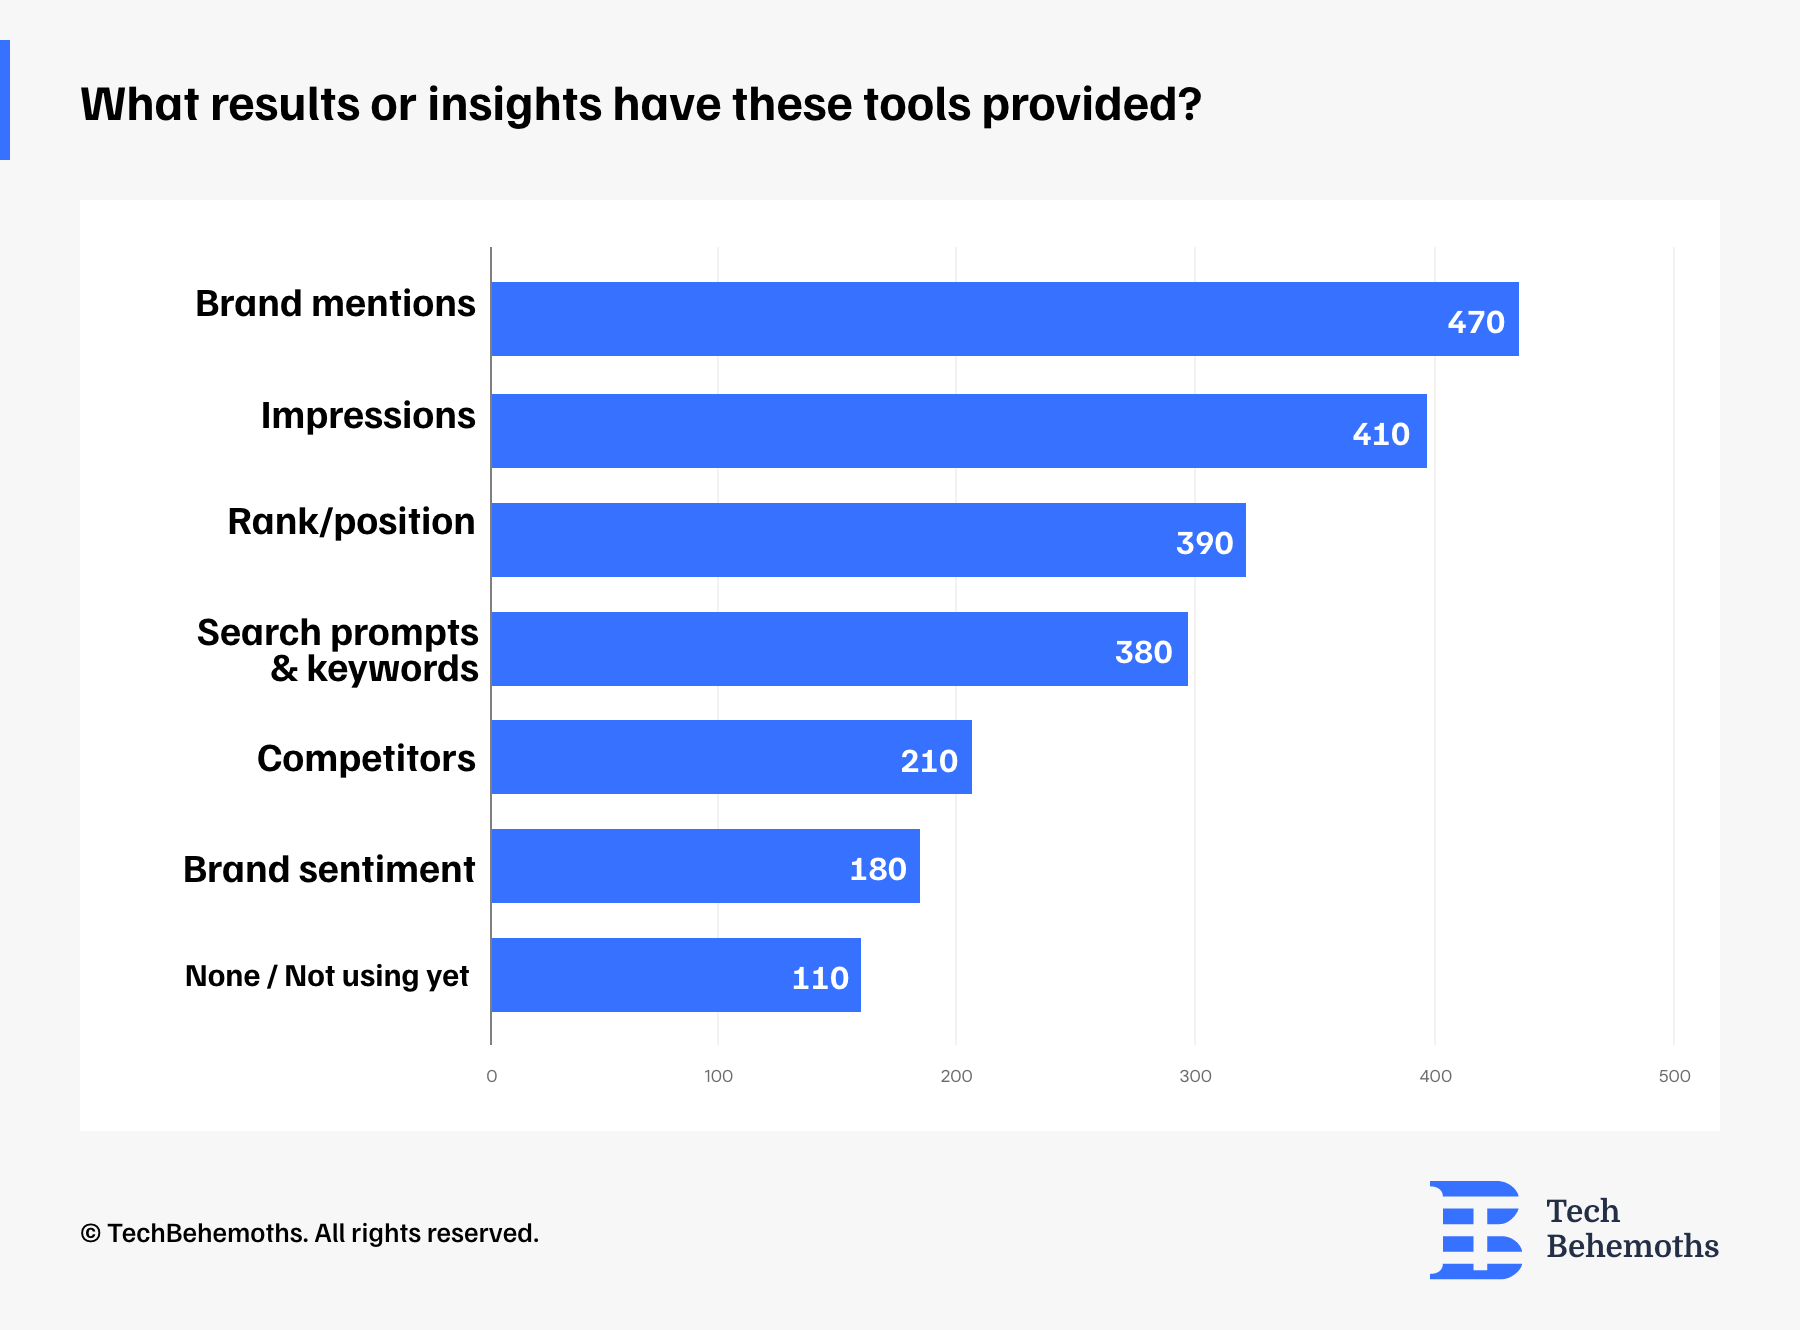
The survey shows that most teams use these tools to see where and how their brand is being mentioned — this was the most common insight.
They also track how often they show up (impressions), their position or ranking, and the keywords or search prompts that lead people to them.
Some are using the tools to keep an eye on competitors or to understand how their brand is being talked about (brand sentiment).
Still, over 100 companies said they haven’t used these tools yet or haven’t seen clear results so far.
So, teams mainly want to know if their brand is showing up in AI search and what it looks like when it does.
What Metrics Do Teams Want from AI Tracking Tools?
When asked what metrics are important to see in AI-powered tracking tools, respondents first mentioned click-through rate (CTR) as the most requested metric, highlighting that teams want to know if users are actually clicking after seeing their brand in AI-powered search results.
Others also want to track their rankings, conversion rate, engagement, and the keywords or queries that trigger their brand.
Some are interested in user sentiment, impressions, and whether they’re cited as a source by AI tools. A few also mentioned social media reach and SGE coverage trends.
Some respondents aren’t sure what to track yet (30 said “unknown/need to research”) or listed other suggestions.
Overall, teams are looking for concrete metrics to understand how AI visibility is truly driving results.
![]()
What Matters Most When Choosing an Analytics Tools?
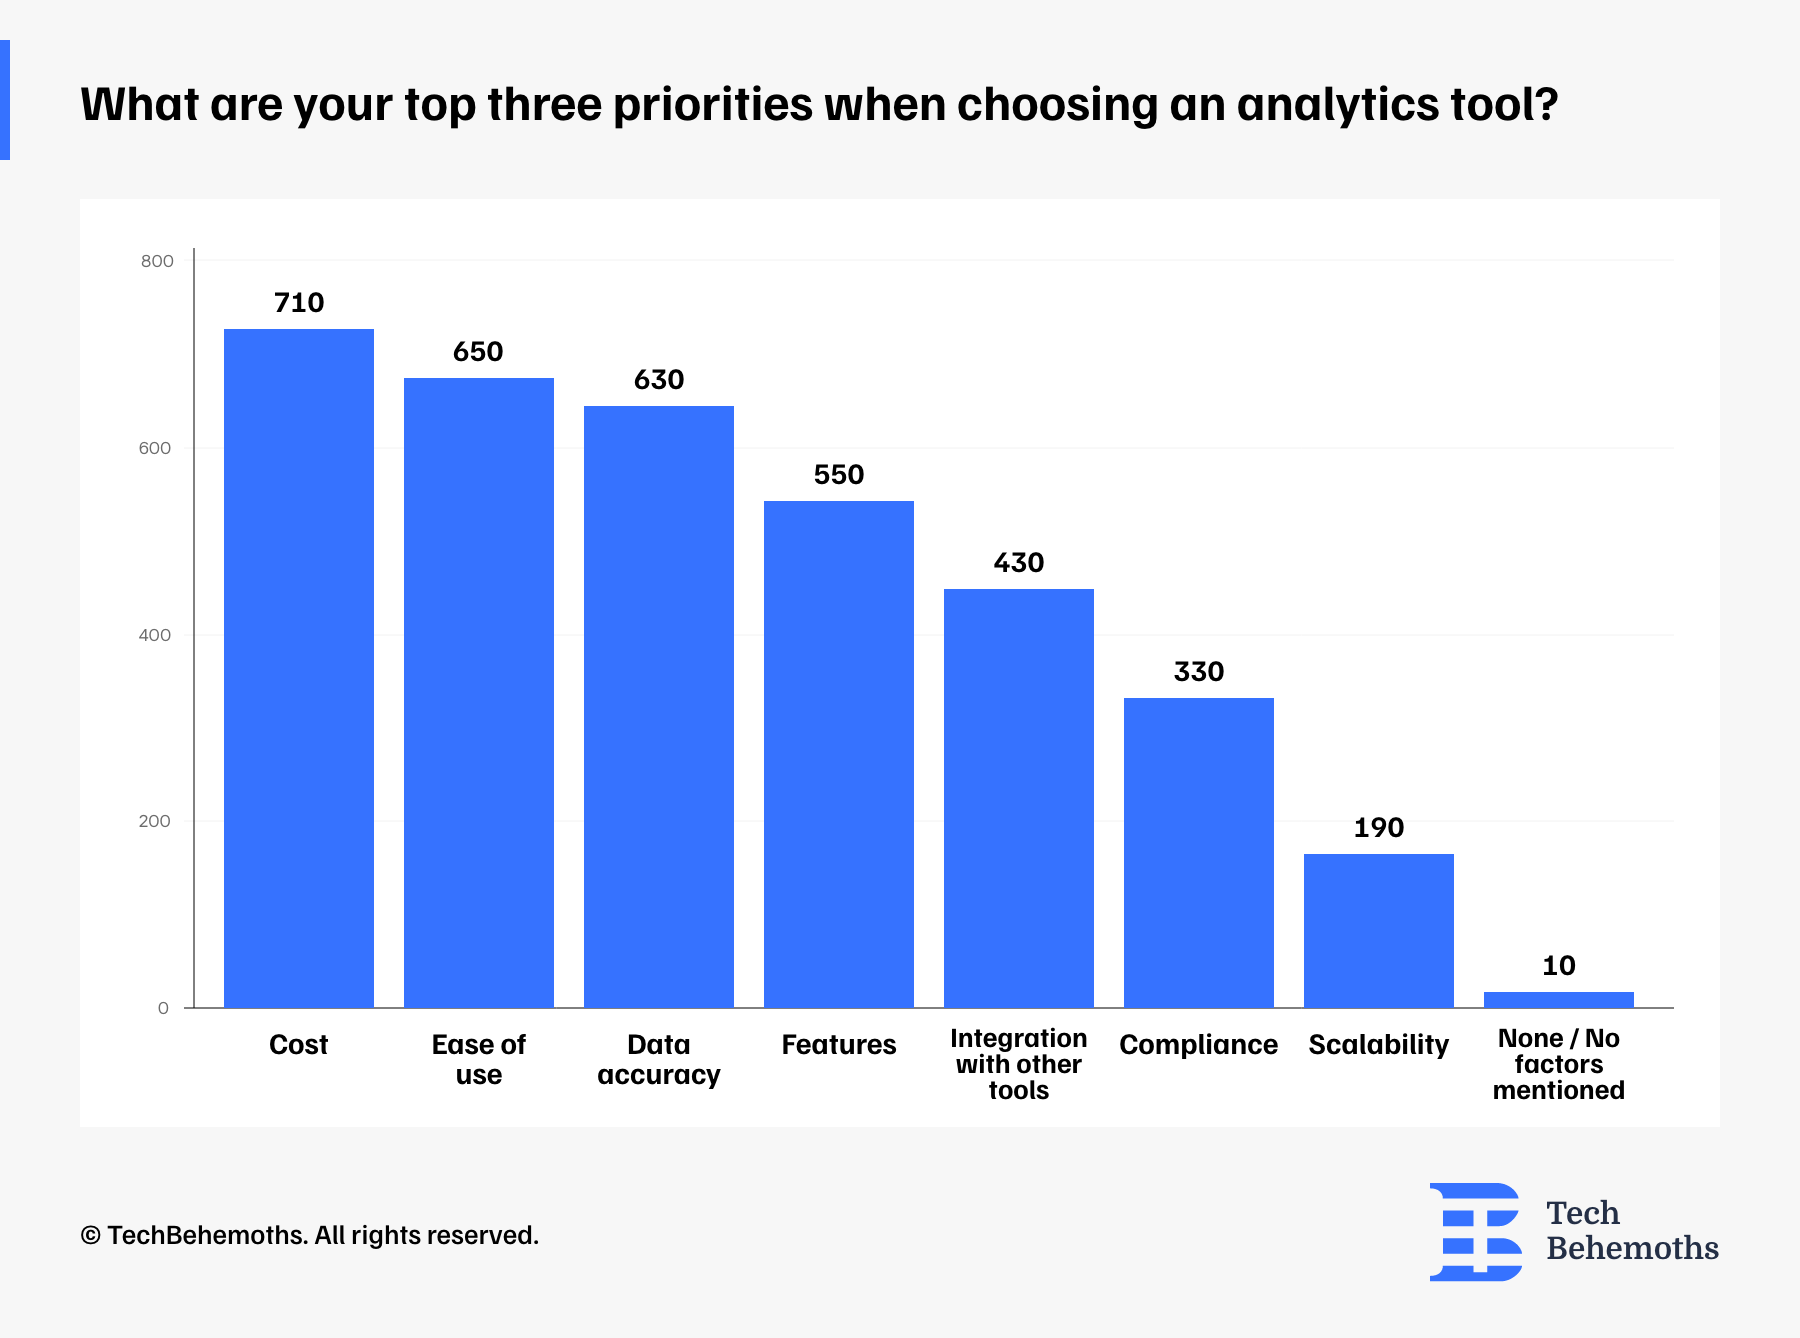
When it comes to picking the right analytics tool, the survey shows that the top 3 priorities are cost (710), ease of use (650), and data accuracy (630). These results show that teams are looking for solutions that are not only useful but also affordable, intuitive, and trustworthy.
Features (550) and integration with other tools (430) are also important, demonstrating that teams appreciate flexibility and connectivity, especially in complex workflows.
Compliance with privacy laws (330) like GDPR and CCPA is a key concern for many, while scalability (190) is a lower priority, likely more relevant to growing or enterprise-level teams.
Only 10 respondents said they had no specific priorities, which suggests most teams have a clear idea of what they’re looking for.
What’s the Biggest Challenge with Analytics Tools?
Most teams want their analytics tools to be simpler, more accurate, and easier to connect with other platforms, without breaking the budget.
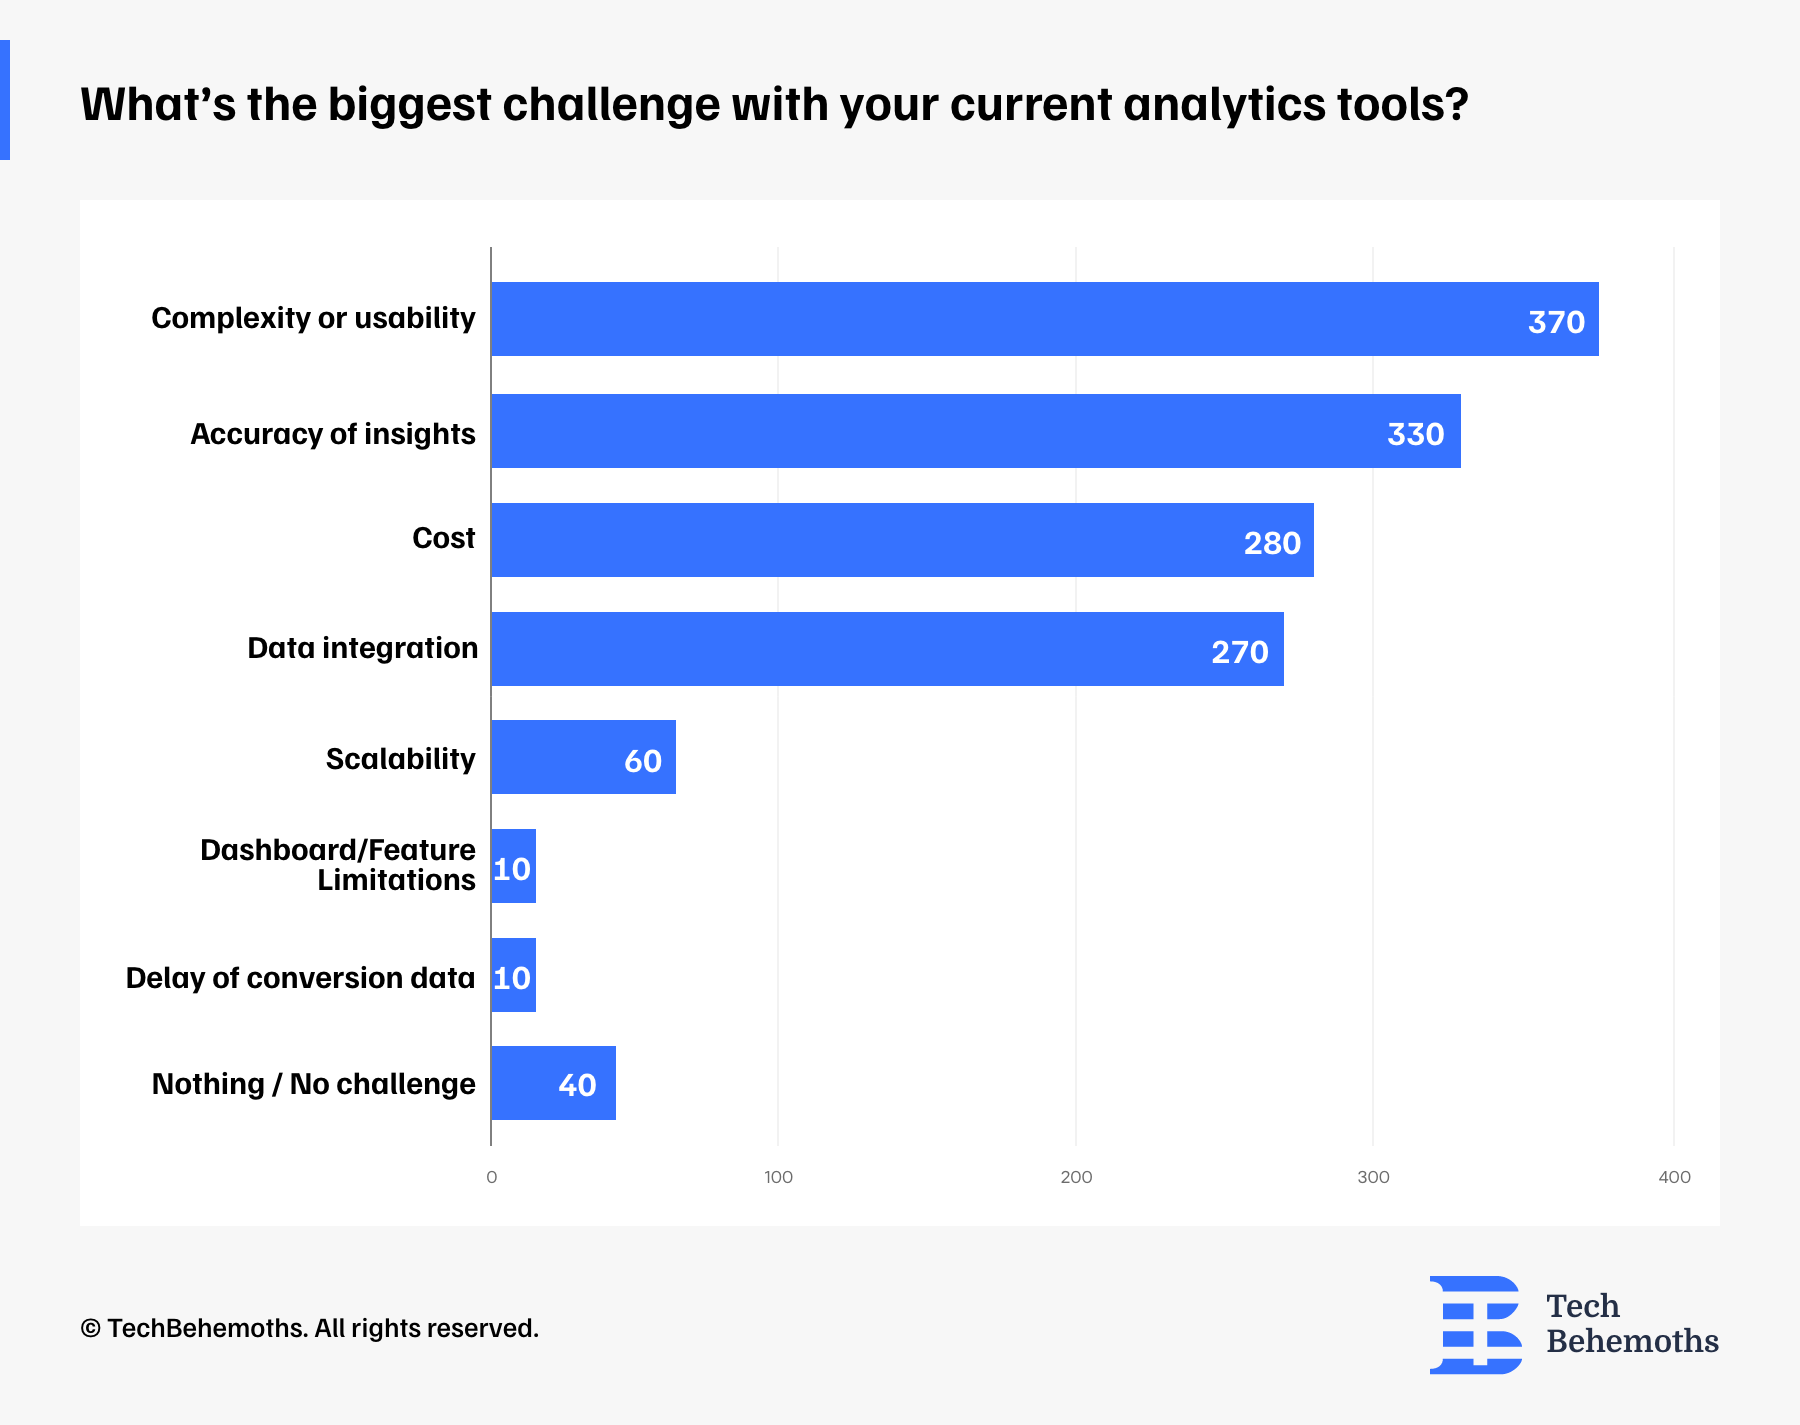
Thus, the biggest frustration for teams is the complexity and usability of their tools, which 370 respondents mentioned. Many find their tools difficult to navigate or too technical for everyday use.
Next, 330 respondents said they struggle with accuracy, highlighting a strong need for more trustworthy and reliable insights.
Cost is another concern for 280 respondents, while 270 struggle with data integration. A few reported issues, like scalability, limited dashboard features, or delayed conversion data. Only 40 respondents said they have no major challenges.
Most Teams Are ’Pretty Happy’ with Their Analytics Tools, But They’re Not in Love Yet
Despite the challenges — like complexity, accuracy, and integration issues — most teams still feel fairly satisfied with their current analytics setup.
-
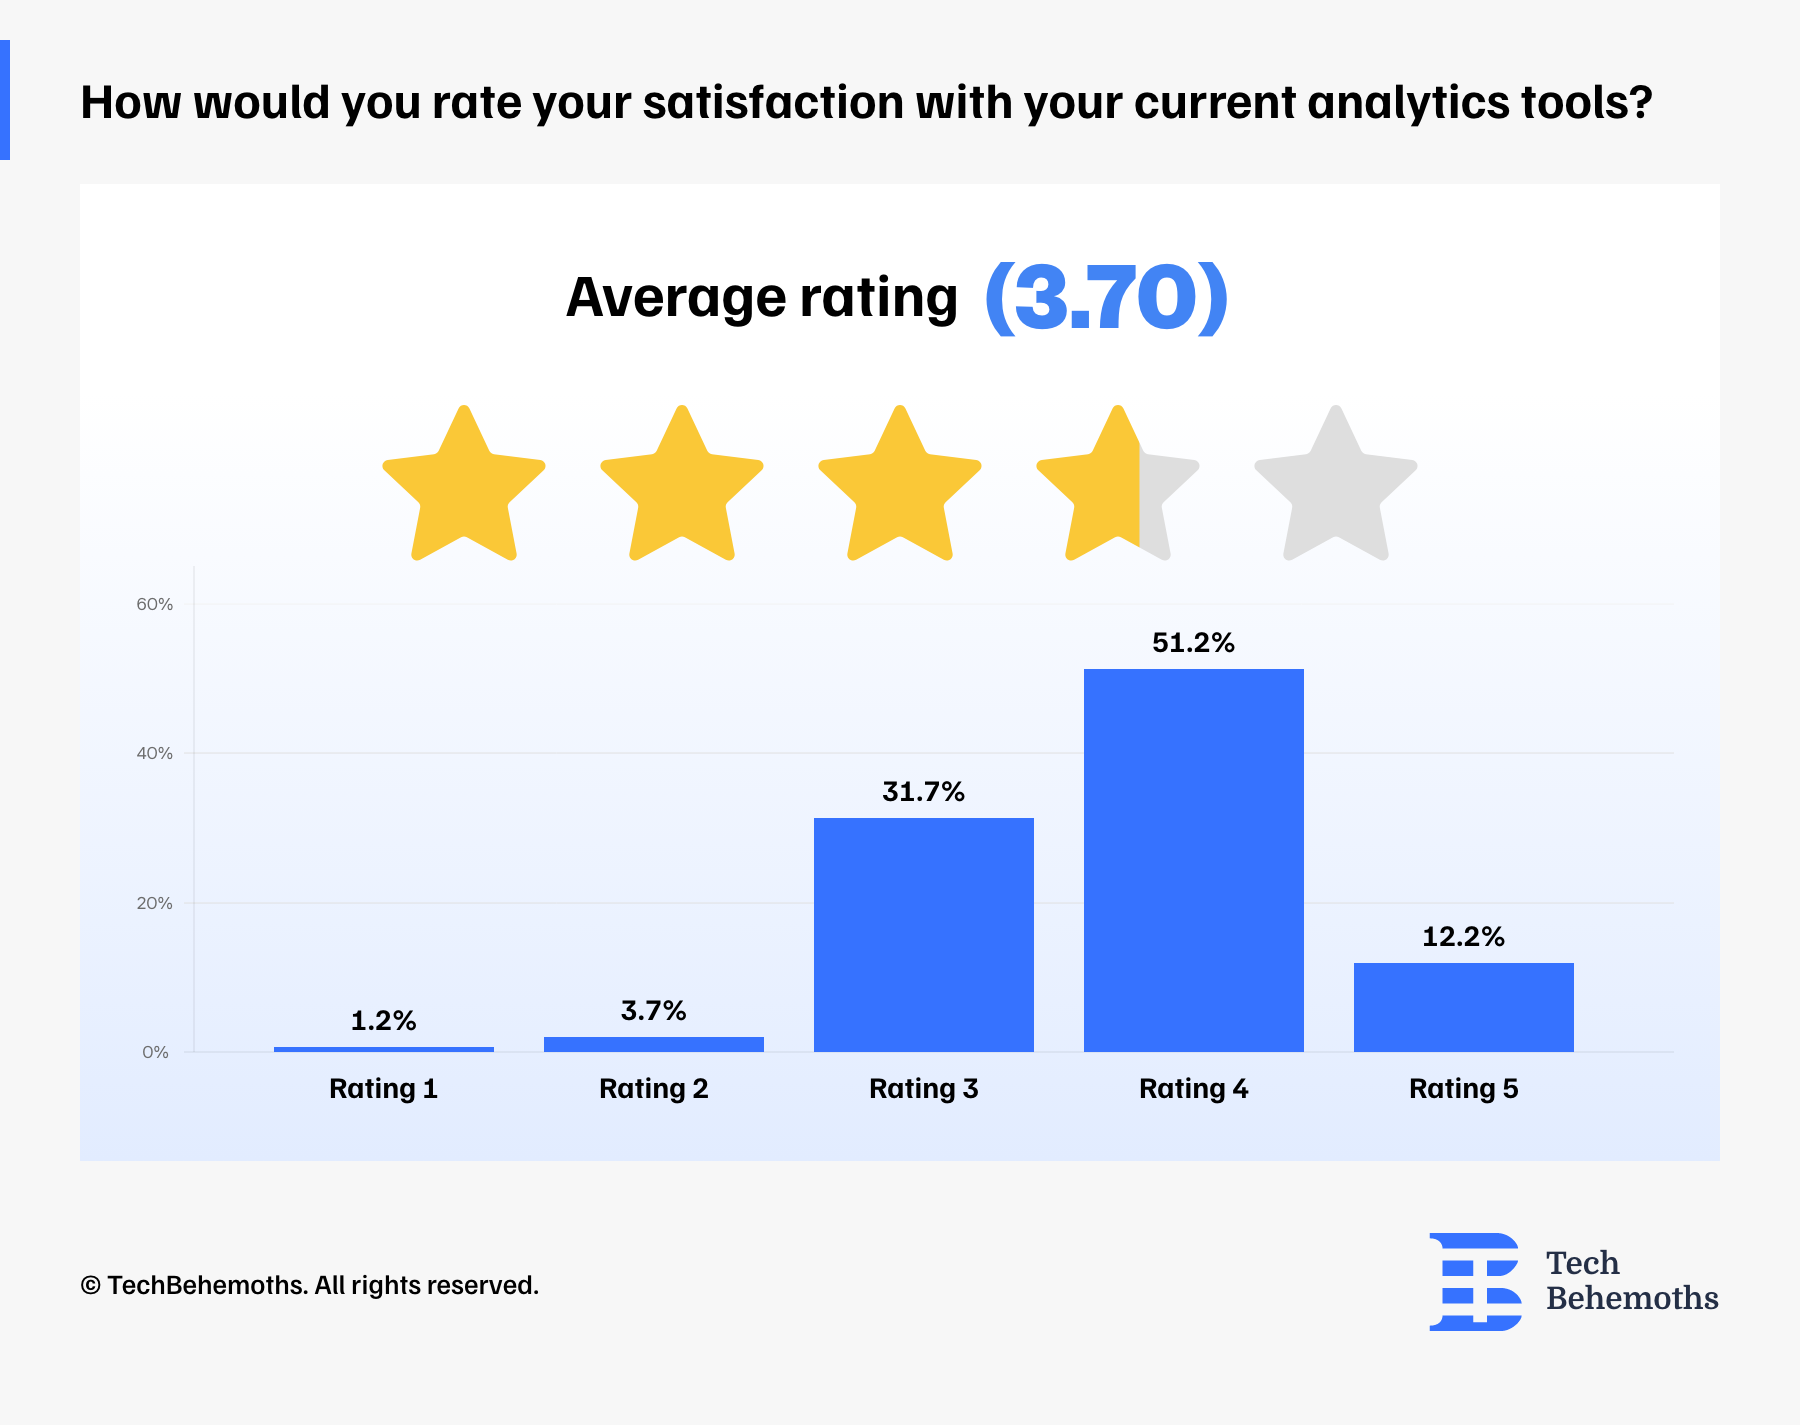
The average rating is 3.7 out of 5, showing a generally positive but not perfect experience.
-
Over 51% gave a rating of 4, and 12% gave the highest score of 5.
-
About 32% rated their satisfaction as 3, indicating a neutral or "it’s fine for now" feeling.
-
Very few rated their tools poorly — just 1.2% gave a 1, and 3.7% gave a 2.
This data speaks to how well most teams manage the tools they have, although there is still a lot of room for improvement.
In Conclusion
Following this detailed analysis, we can firmly state that the analysis tools are essential for tech firms to make decisions, track success, and plan for growth. While most teams rely on just a few tools and still use Google Analytics, many are exploring alternatives and AI-powered solutions to stay ahead.
The survey shows that teams are mostly happy with their tools, but not without challenges. Complexity, accuracy, and integration remain top concerns. However, it is proven that companies value the data insights provided by analytics tools and are constantly looking for better ways to measure performance.
We hope these findings help you reflect on your own analytics strategy and explore new tools that better fit your goals.
Looking for Data Analysis Services?
Check our list of top Data Analysis Companies on TechBehemoths!
Partner Companies
The survey was not limited to any geographical region or country, and its main target was the global community of IT companies and web agencies. As such, survey respondents come from 830 IT companies across 34 countries. On this occasion, TechBehemoths is proudly announcing and crediting the list of partner companies that helped spread the word and gather answers for this survey.
- 2IM AGENCY, United States
- a1qa, United States
- Act Digital, India
- Advertising Agency, India
- Alpha-X Info Tech, Bangladesh
- Alto Servicios Comunicación, Spain
- Aqaba Digital, United States
- Balancelogic, United States
- BeTranslated, Spain
- Bluetrain, Canada
- Burlamaqui Marketing & Strategy, Brazil
- CG Technologies Corp., Canada
- Clearlead AI Consulting, Ireland
- Corpela Inc, Pakistan
- Crystal Translation, Lebanon
- ECS Infotech, India
- D Cloud Solutions, India
- Digimark, Australia
- Digital Reach Ltd, Ghana
- DNA325, Estonia
- Doers Advertising, Egypt
- Dot Agency, Pakistan
- Dreams Media and Marketing, Nepal
- Exchange Technology Services, Canada
- Forward Training and Consulting FZE, United Arab Emirates
- Fulfillment-Box, Germany
- Graphica Studios-CDO, Philippines
- ITForce, Ukraine
- Jucebox Local Marketing Partners, United States
- KANVID, China
- Keenclick Digital Agency LTD, United Kingdom
- KK Media., Latvia
- Ledger Labs, United States
- Logotypely, Portugal
- LVRG Media, United States
- Made by Anuj, Nepal
- Marketer Medley, United States
- Media Accent, Nigeria
- Mentio, United Kingdom
- Microsolve, Australia
- Mobiteam, Germany
- Muse Marketing Group, Canada
- MWIMMERDESIGN, Germany
- NETK5, China
- new skin design, Spain
- Omega Digital, Vietnam
- One Click SEO, United States
- Optimise Media, United Kingdom
- Orange Tulip Studio, United States
- Outreach, India
- Passion Digital United Kingdom
- Pentest, Portugal
- PROCRM, Ukraine
- RadASO, United States
- Rankability, United Arab Emirates
- Rocket House Pictures, United States
- Roman.ua, Ukraine
- Sailer Research & Development, Finland
- Scaleroot Technologies, India
- SEO Animation, India
- SEO Expert Gold Coast, Australia
- Site Brașov, Romania
- Snowball Consulting, Estonia
- SunHouse Marketing, Israel
- SupportYourApp, Ukraine
- Tanosec Cybersecurity, South Africa
- Thackeray Design, United Kingdom
- Time Booster Marketing Camer, Cameroon
- Triune Digitals, Armenia
- Tyflex Investments, Zimbabwe
- Uniko Studio, United Kingdom
- Vivideye Concepts, Ghana
- VOK DAMS China, China
- W3 Group Marketing, United States
- WEBIMA, Iran
- Wild Creek Web Studio, India
- zeropoint7 Studio, United States
- Zintix, Pakistan
- ZONE3000, United Arab Emirates
- Zynet, Philippines
I absolutely love embracing new opportunities and connecting with people. Every project is a chance to analyze, create, and work until I am satisfied with the results. Bringing creativity into every aspect of my work offers a fresh perspective on turning ideas into reality. Paying attention to the details is key because it's the little things that truly make all the difference.
Discover more TechBehemoths Insights
Learn practical tips and insights about IT Companies, how to find the right company for your projects.
Read the latest news about Market Trends and fresh Interviews.