The State of Mobile App Development: Prices and Processes


The demand of Mobile App Development services has grown in the past several years across the globe as multiple businesses are starting to reach out the global community in a digital manner. However, considering the constantly evolving technology frameworks and with the appearance of new mobile app types, the cost of Mobile app development services has been fluctuating as well.
Therefore, between February 1-7, 2024 TechBehemoths surveyed 959 companies across 52 countries, specializing in mobile app development services to identify the costs, processes, and challenges companies face.
Survey respondents profile
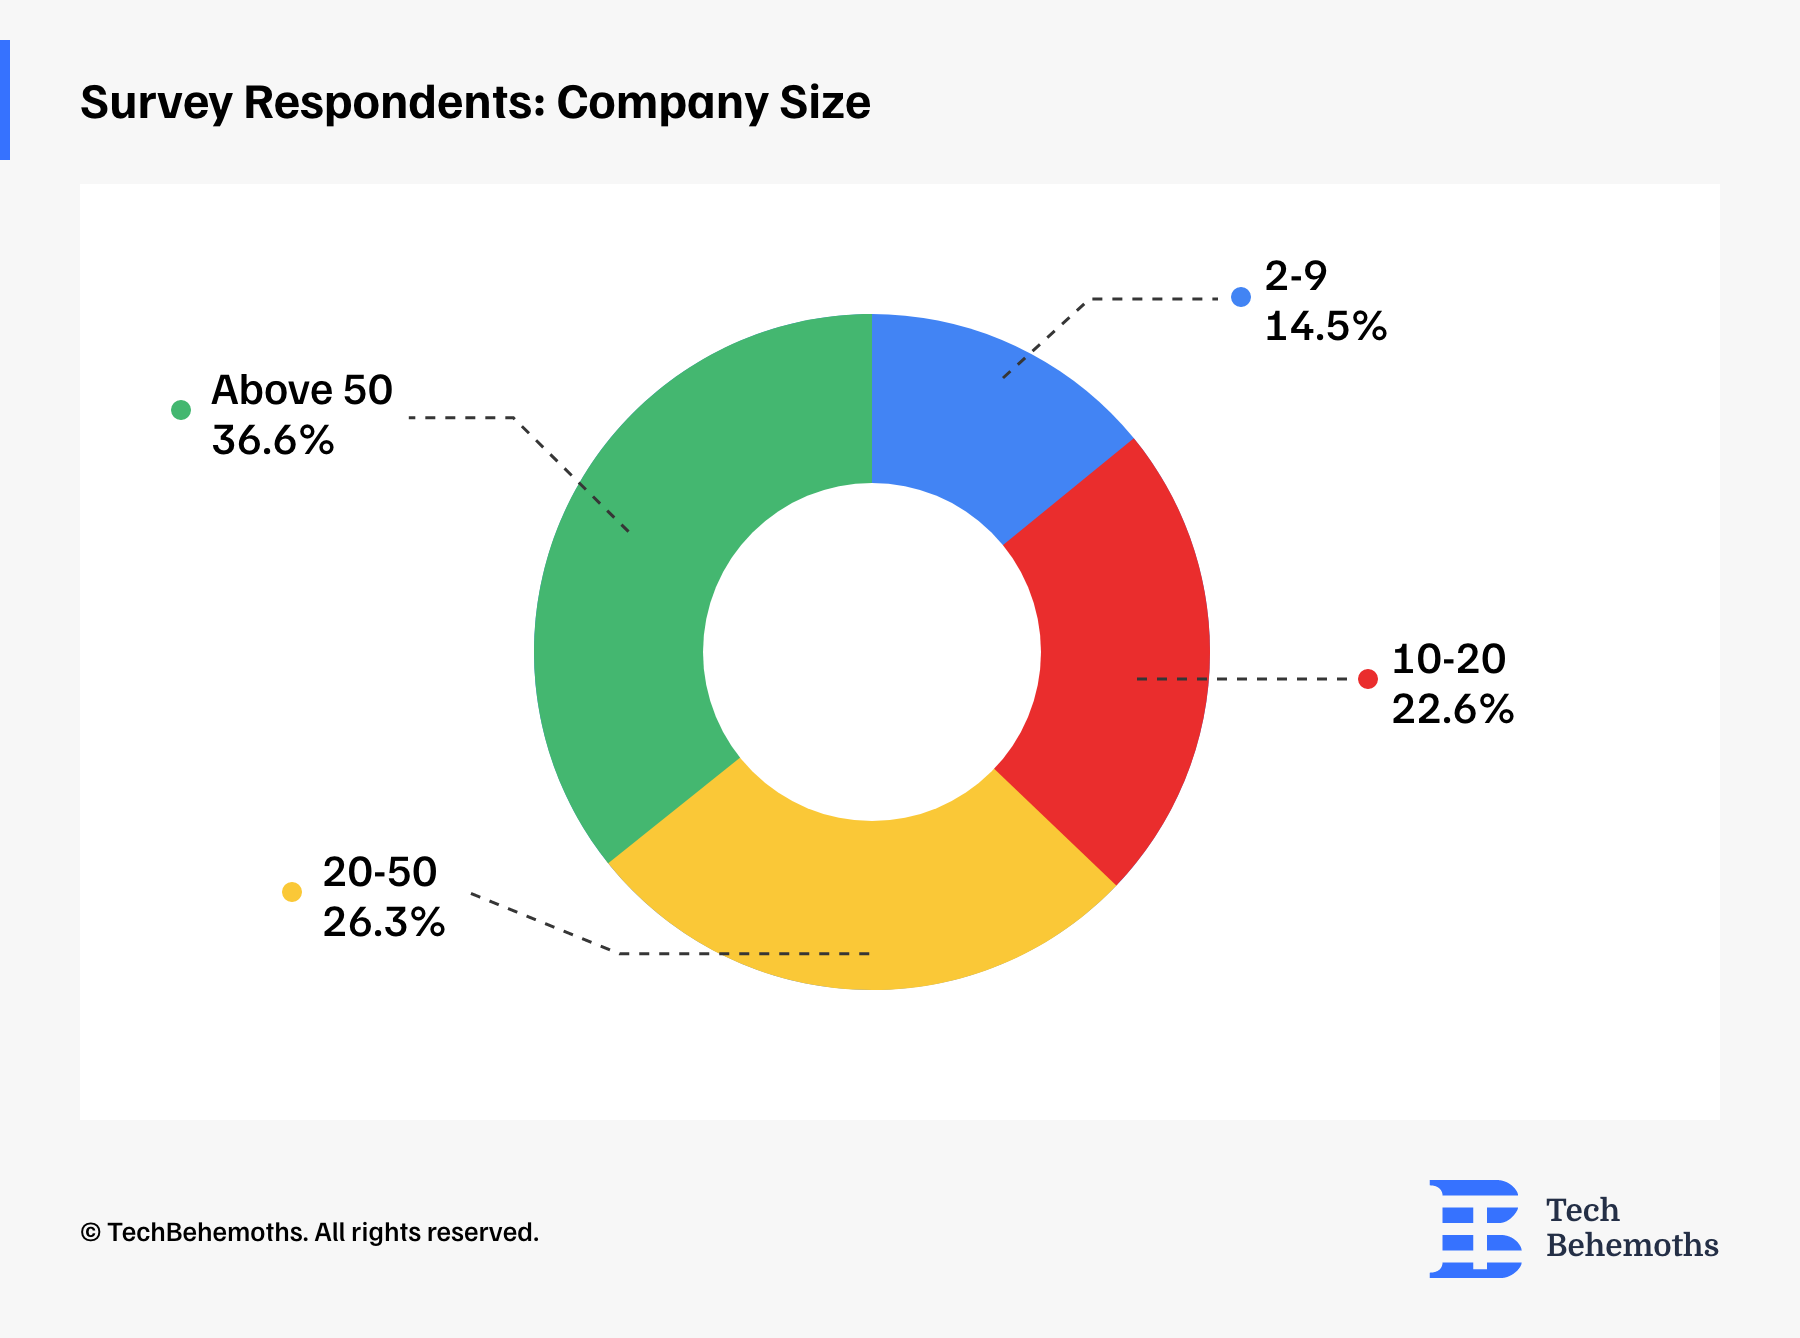
The largest segment of respondents comes from companies with more than 50 employees, accounting for 36.6% of the total. Following this, companies with 20-50 employees make up 26.3% of the survey participants, indicating a strong representation of medium-sized enterprises. Smaller companies with 10-20 employees hold a 22.6% share, demonstrating that the industry also consists of growing businesses with potential for expansion. Lastly, the smallest companies with 2-9 employees represent 14.5% of the respondents, reflecting the involvement of startups and small-scale businesses in the mobile app development market
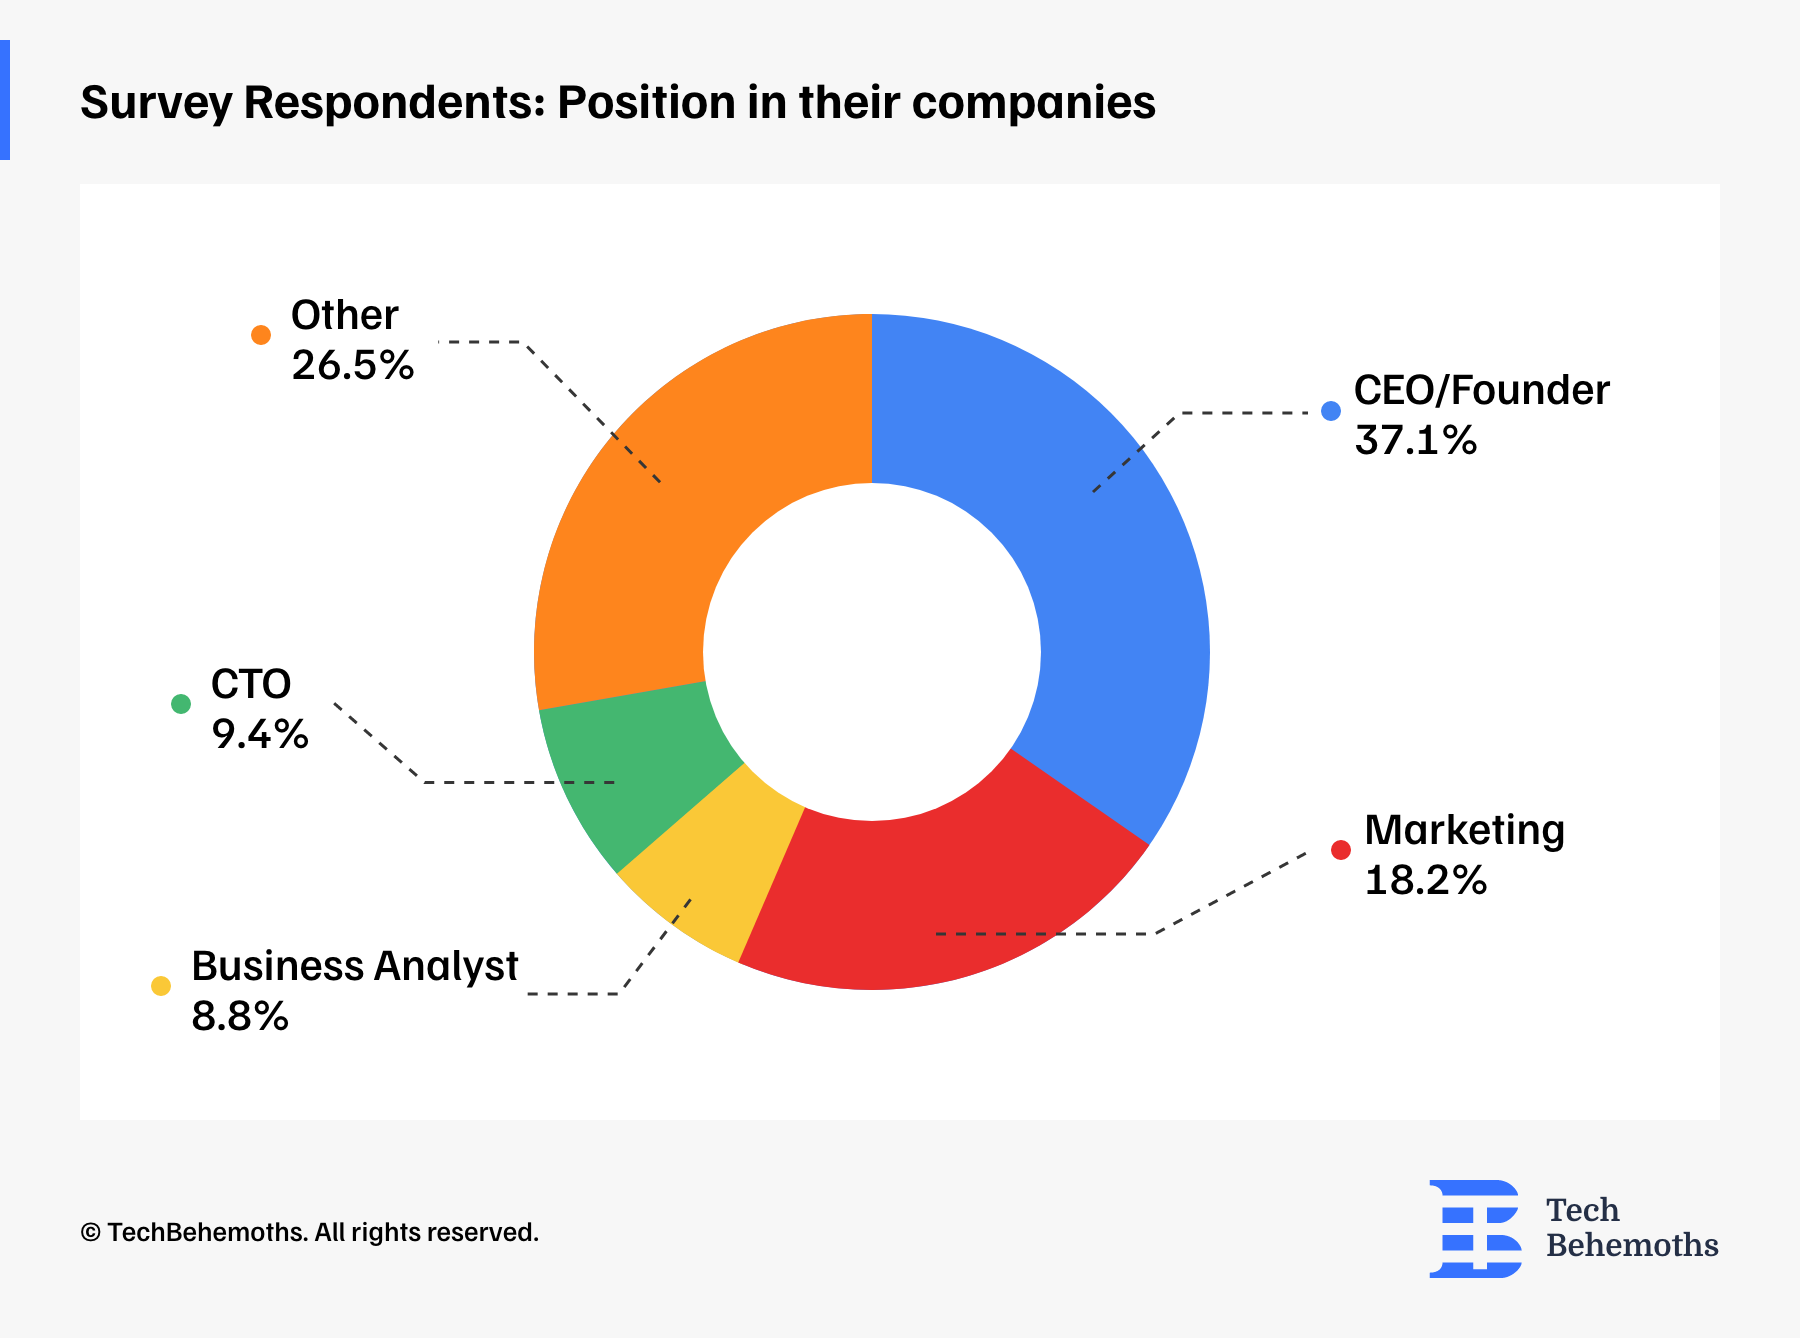
The survey data shows that the majority of respondents hold top-level positions, with 37.1% identifying as CEO/Founder, which underscores the engagement of high-ranking decision-makers in the survey. The next significant group is from Marketing at 18.2%, followed by a diverse mix of other professionals - 26.5%, indicating a broad range of roles and perspectives.
Mobile App Development - Project Complexity Share
The survey reveals a nearly even split in the perceived complexity of recent mobile app development projects. About half of the projects, 48.9%, were classified as medium complexity, which suggests a balance between feature richness and development challenges. Meanwhile, a slightly lesser share of the projects, 47.3%, were deemed complex, indicating a significant number of developers are engaging in more sophisticated and potentially resource-intensive app development endeavors.

Mobile App Development Platforms by Popularity
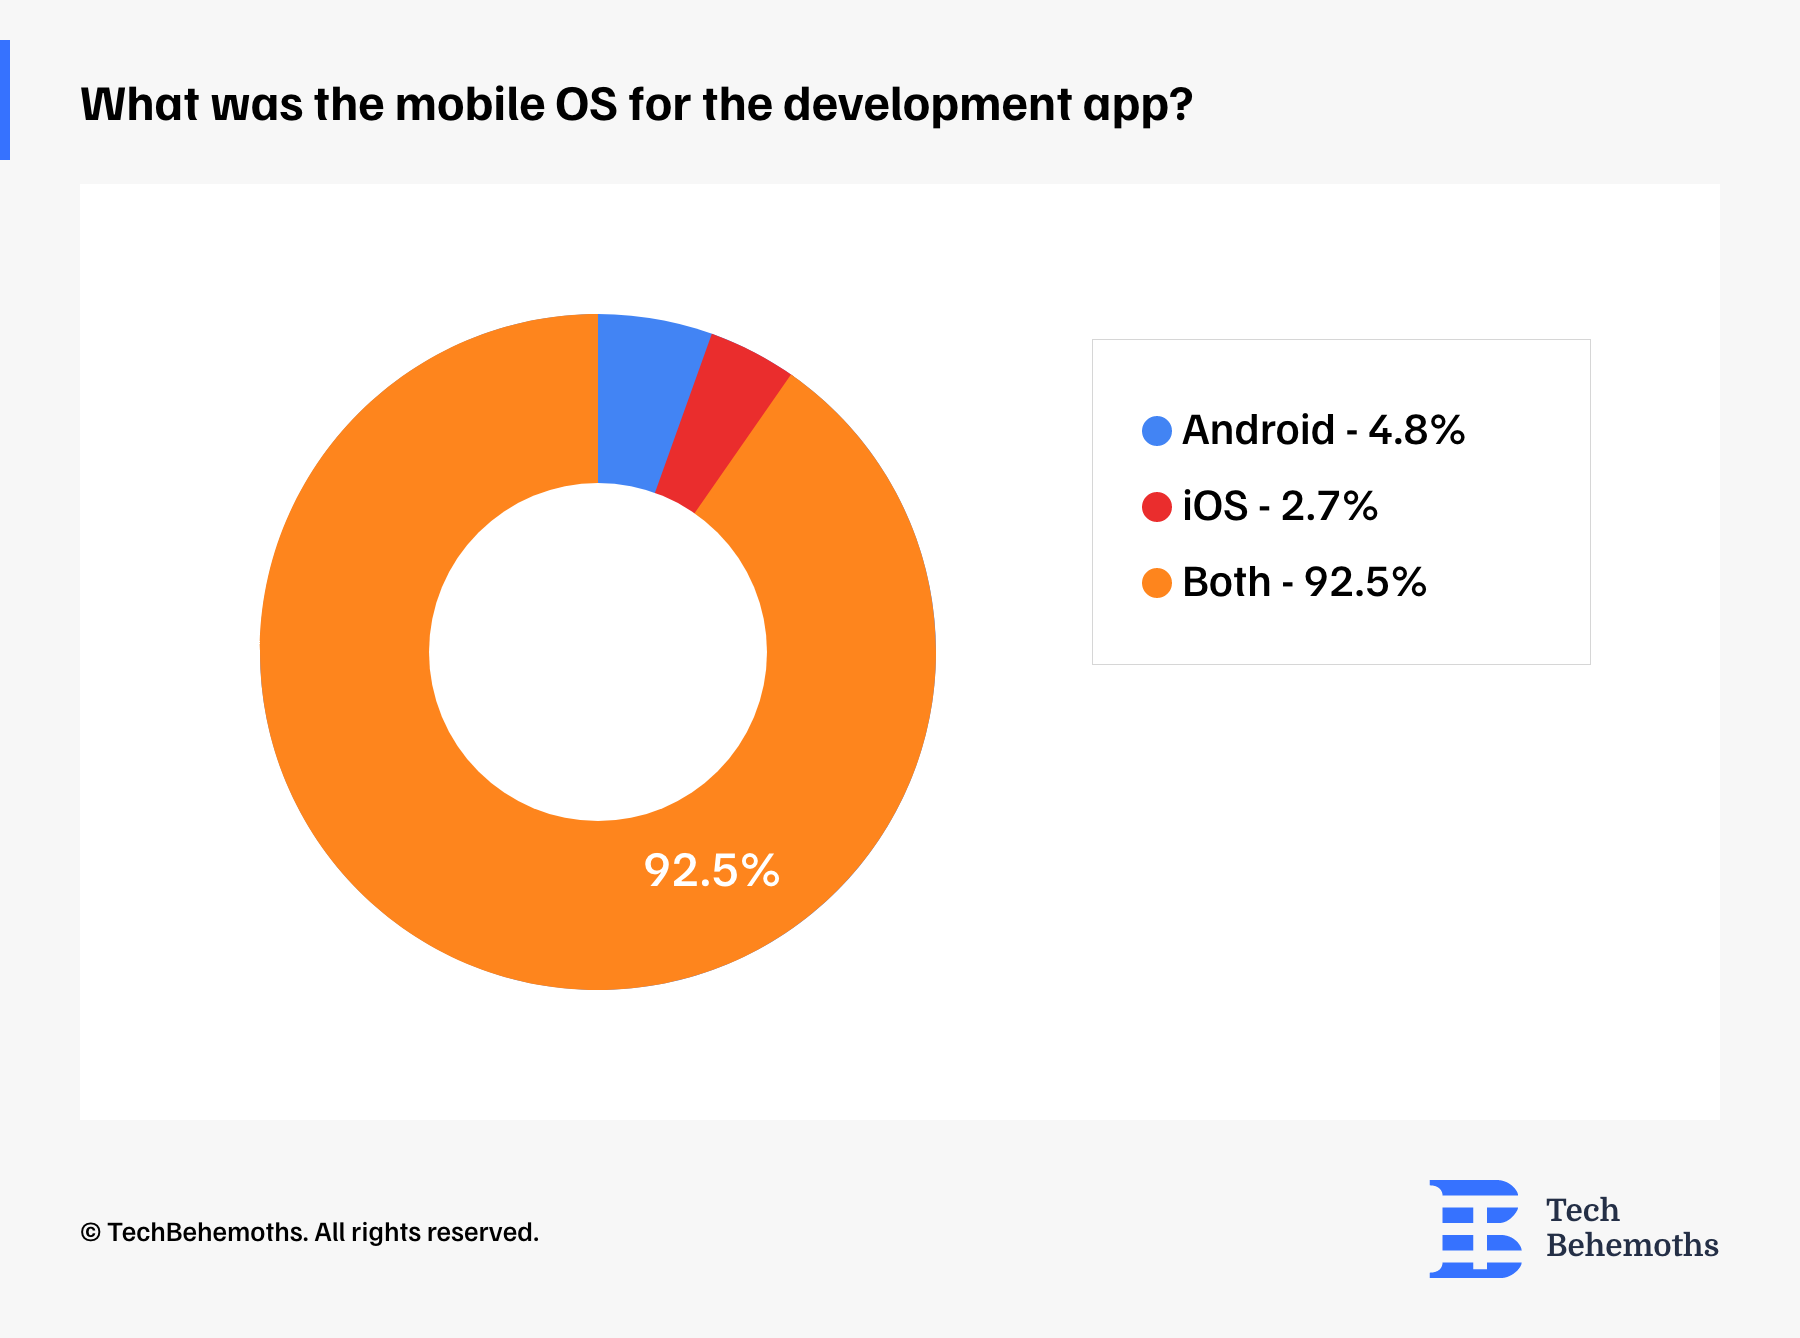
The survey results from the 186 respondents indicate a predominant preference for cross-platform mobile app development, with 92.5% of the developers reporting that they created apps compatible with both Android and iOS. This overwhelming majority suggests a strategic focus on maximizing market reach and user accessibility by targeting the two leading mobile operating systems simultaneously.
On the other hand, a small fraction of developers specialized in single-platform applications, with only 4.8% developing exclusively for Android and an even smaller 2.7% focusing solely on iOS. This distribution highlights a trend in the industry towards cross-platform development to cater to a broader audience, while only a minority opts to specialize in a single ecosystem.
Most popular Mobile App Monetization Strategies
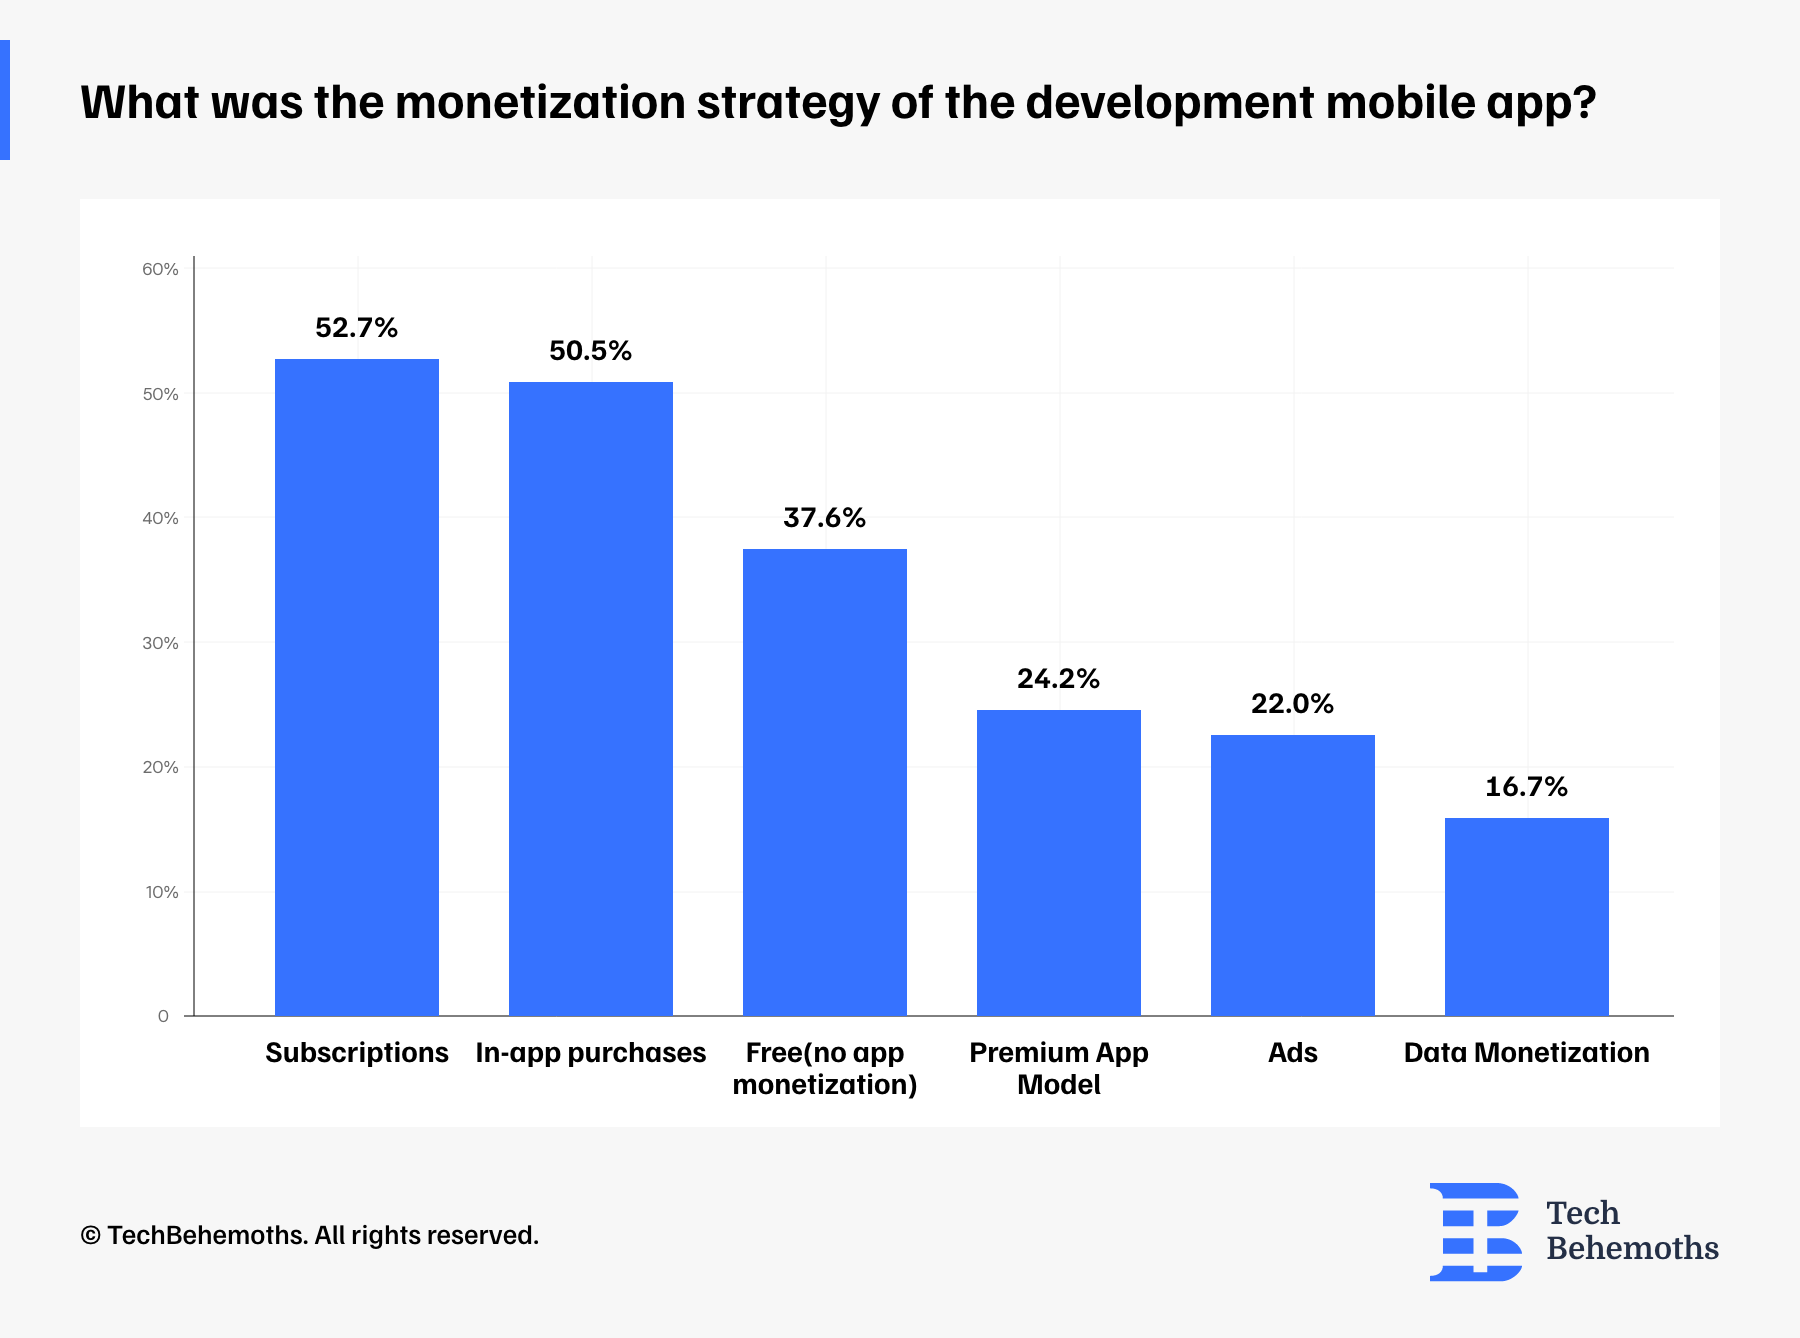
The monetization strategies employed by mobile app developers, present a diverse approach to generating revenue. Subscriptions lead as the most popular method, with 52.7% of developers incorporating this strategy, indicating a trend towards creating a steady revenue stream through ongoing user payments. In-app purchases are just as prevalent, with 50.5% of developers utilizing this model, suggesting that offering additional content or features for a fee within the app is equally favored.
The data also shows that a significant portion of apps, 37.6%, are released without any monetization strategy, which may reflect a focus on other objectives such as user acquisition, brand building, or serving as a complimentary service to another product or platform. The premium app model, where users pay upfront to download the app, is less common, used by 24.2% of developers, possibly due to the competitive nature of app marketplaces where free apps are abundant.
Advertising is another strategy employed, with 22% of apps displaying ads, a lower percentage compared to other strategies, which might be due to user experience concerns or the desire for a cleaner, ad-free interface. Finally, data monetization is the least utilized strategy at 16.7%, highlighting concerns around privacy and the potential limitations in user acceptance when personal data is used as a revenue source. This varied landscape of monetization strategies reflects the dynamic and evolving nature of the mobile app industry, where developers must balance profitability with user preferences and marketplace trends.
Mobile app development process duration
(from ideation to launch)
The majority of the projects, representing 37.8%, have a development cycle lasting between 5-12 months, highlighting a mid-range period that allows for thorough development and testing. Another substantial segment of the projects, amounting to 35.4%, is completed within a shorter span of 2-5 months, suggesting a significant number of developers are capable of delivering apps at a faster pace, potentially reflecting a streamlined process or less complex app requirements.
The data also indicates that for a smaller proportion of projects, 8.1%, the development process is even more expedited, taking 2 months or less, which could point to very focused, simple app concepts or high-efficiency development practices. Longer development timelines are less common, with 6.6% of projects taking 1-2 years and a mere 3% exceeding two years, which may involve highly complex, large-scale applications or those with extended research and development phases.
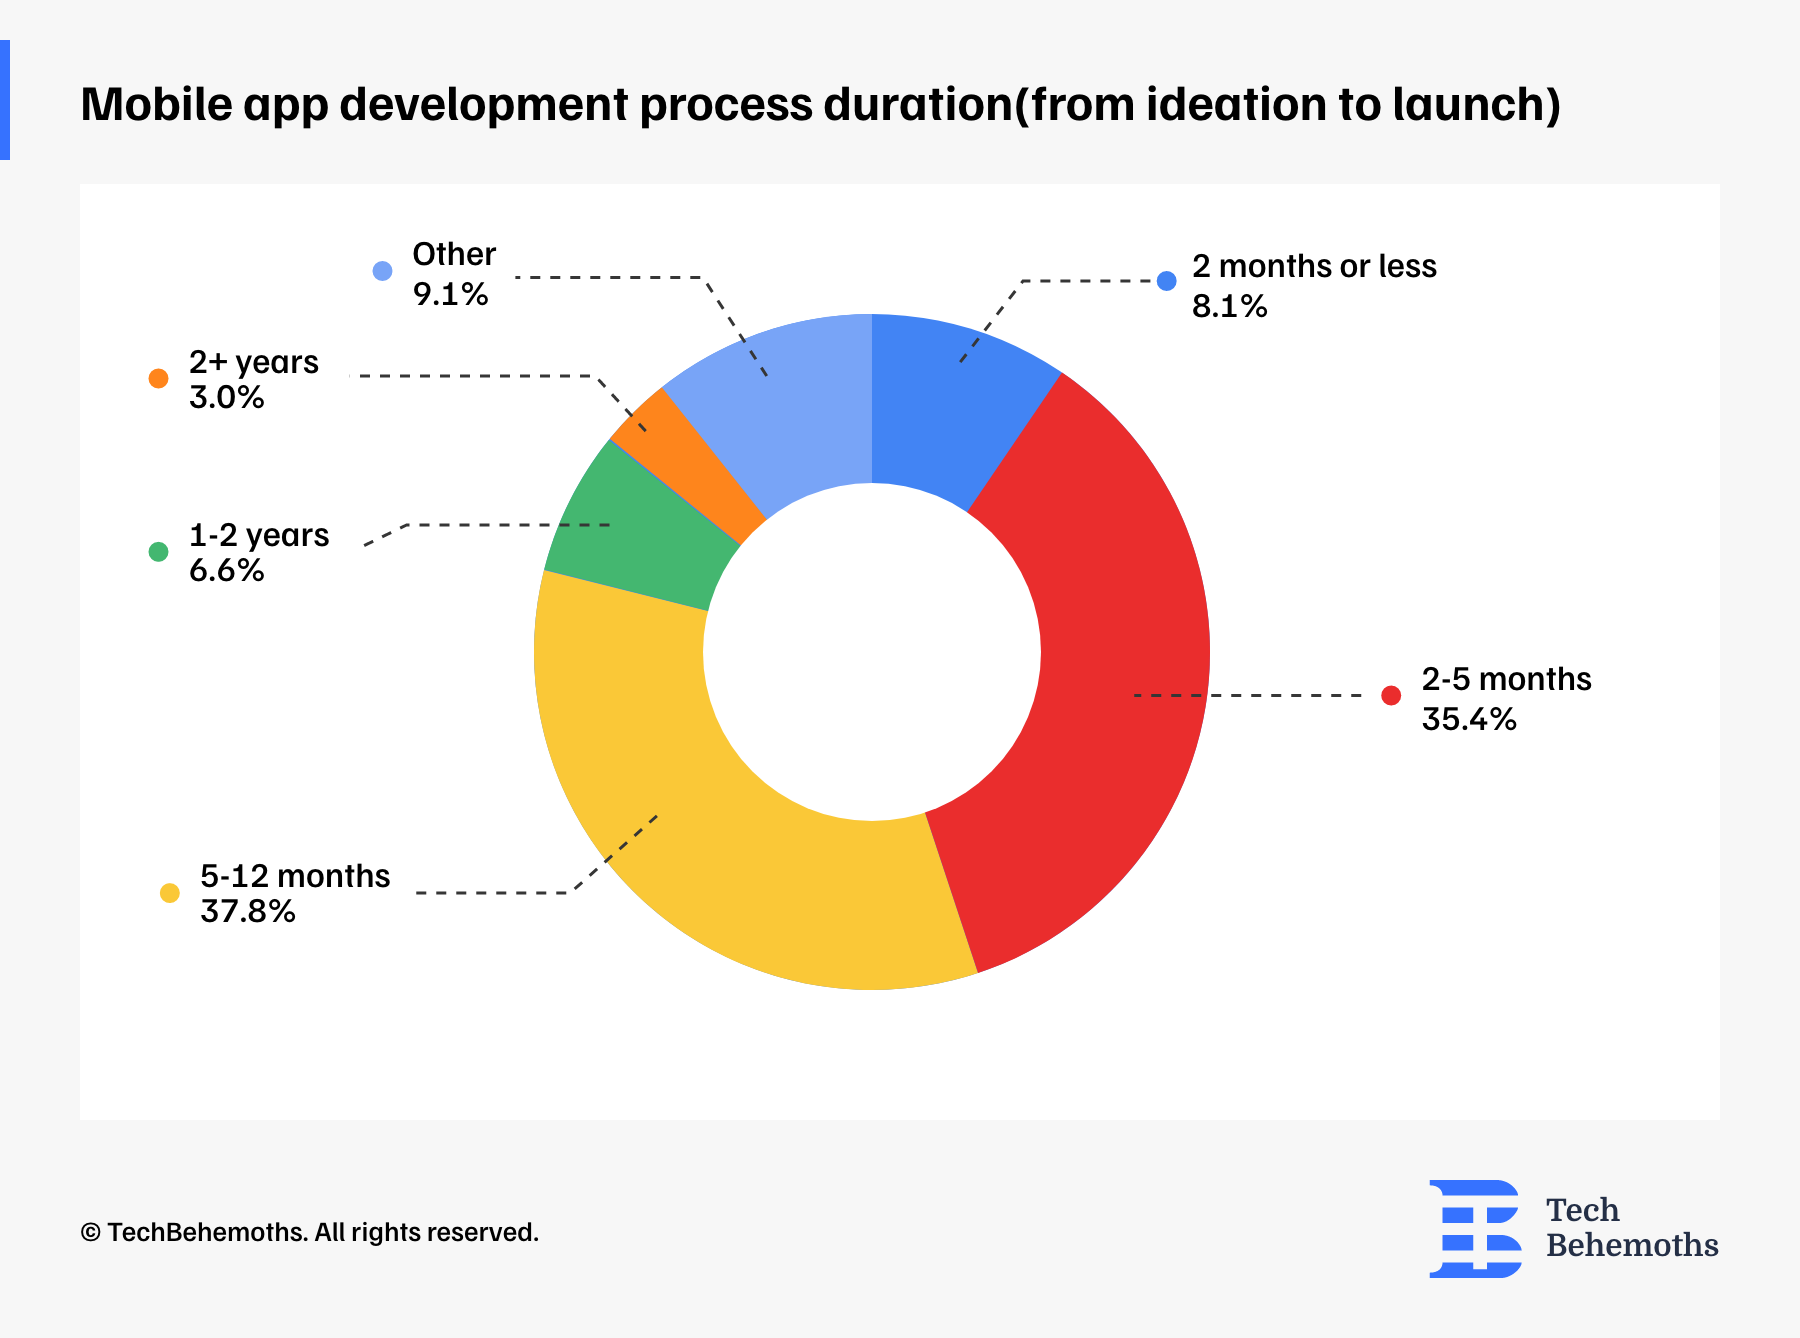
An 'Other' category accounts for 9.1% of the responses, which could include varied timelines not specified in the given options or non-traditional development processes.
The Cost of Developing Mobile Apps
When asked about the cost of developing a mobile app, survey respondents declared the largest portion of developers, accounting for 44%, indicate that the cost of creating a mobile app exceeds $20,000, which reflects the significant investment required for more complex or feature-rich apps that likely demand extensive development time and resources. A smaller yet notable segment of 17.6% falls within the $8,000 to $20,000 range, suggesting that there is a considerable number of mid-tier applications that balance functionality with cost-effectiveness.
Moving to the lower end of the cost spectrum, 7.7% of the apps were developed with budgets ranging between $5,000 and $8,000, while slightly fewer, at 8.8%, cost between $3,000 and $5,000. These figures indicate that a segment of the market is focused on developing less expensive apps, possibly targeting niche markets or with limited functionalities. An even smaller proportion of the market, 10.4%, managed to keep costs between $1,000 and $3,000, which may correspond to very basic or minimal viable products.
Only 4.4% of the apps were developed for $1,000 or less, highlighting that low-cost app development is relatively rare, possibly due to the minimum requirements of technical complexity, design, and testing inherent in app creation.
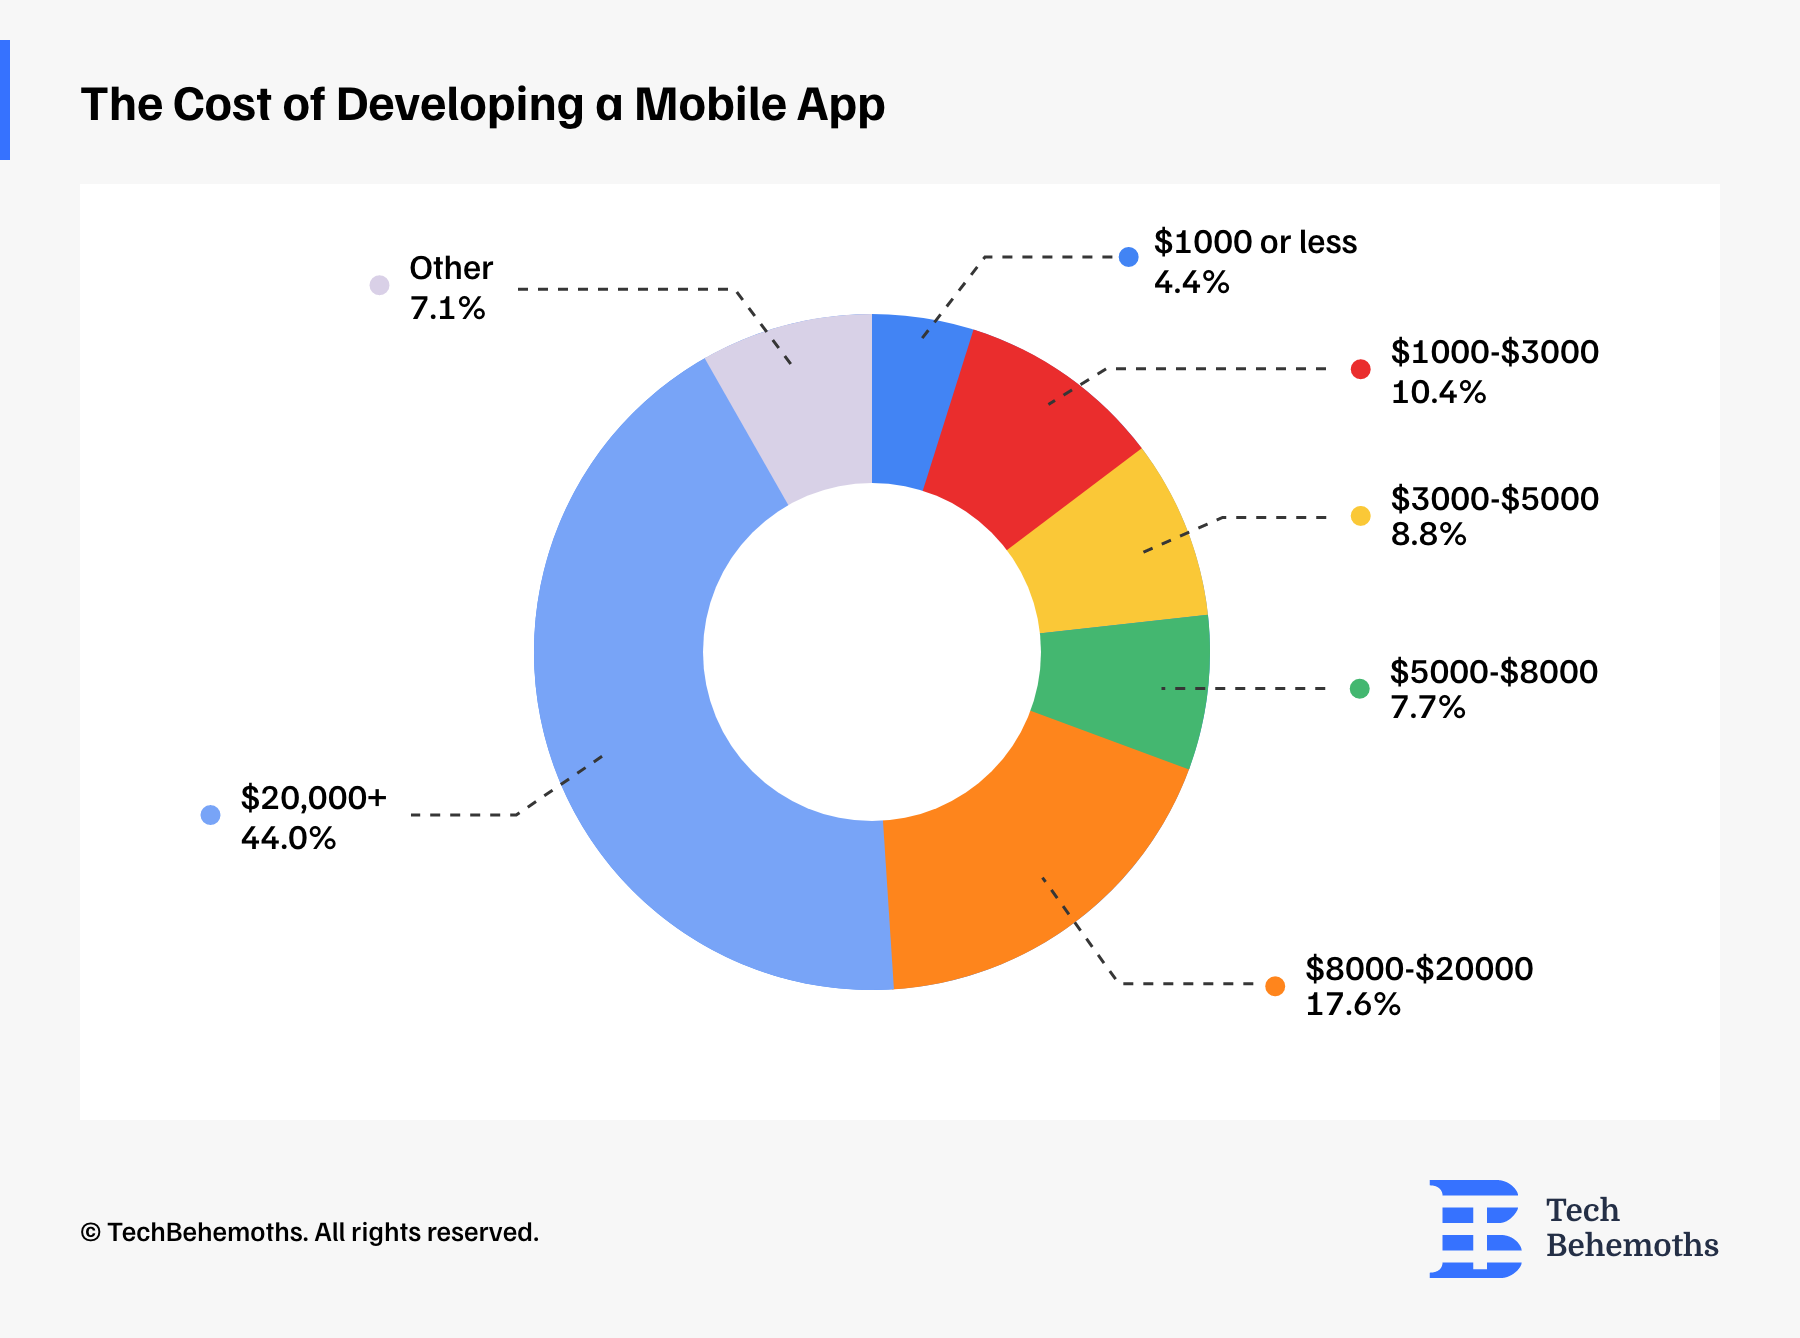
Lastly, the category labeled 'Other,' comprising 7.1% of the responses, likely includes various cost structures not captured by the predefined ranges, which could range from extremely low-budget projects to high-cost endeavors not specified in the survey options.
Number of assigned developers to mobile app development
Regarding the average number of assigned developers to project, the data reveals a diversity of projects, accounting for 40.3%, which were handled by small teams of 1 to 3 developers. This could mean that a large segment of mobile app development can be managed by a few skilled individuals, likely reflecting the presence of smaller-scale projects or the efficiency and expertise of these teams.
A close second, 35.5% of projects involved slightly larger teams of 3 to 5 developers, indicating that a collaborative approach is common and perhaps necessary for a moderate level of app complexity or scope. Meanwhile, 22% of the projects were developed by teams of 5 to 10 developers, showcasing that a considerable number of apps require more substantial manpower, potentially due to higher complexity or the need for diverse skill sets.
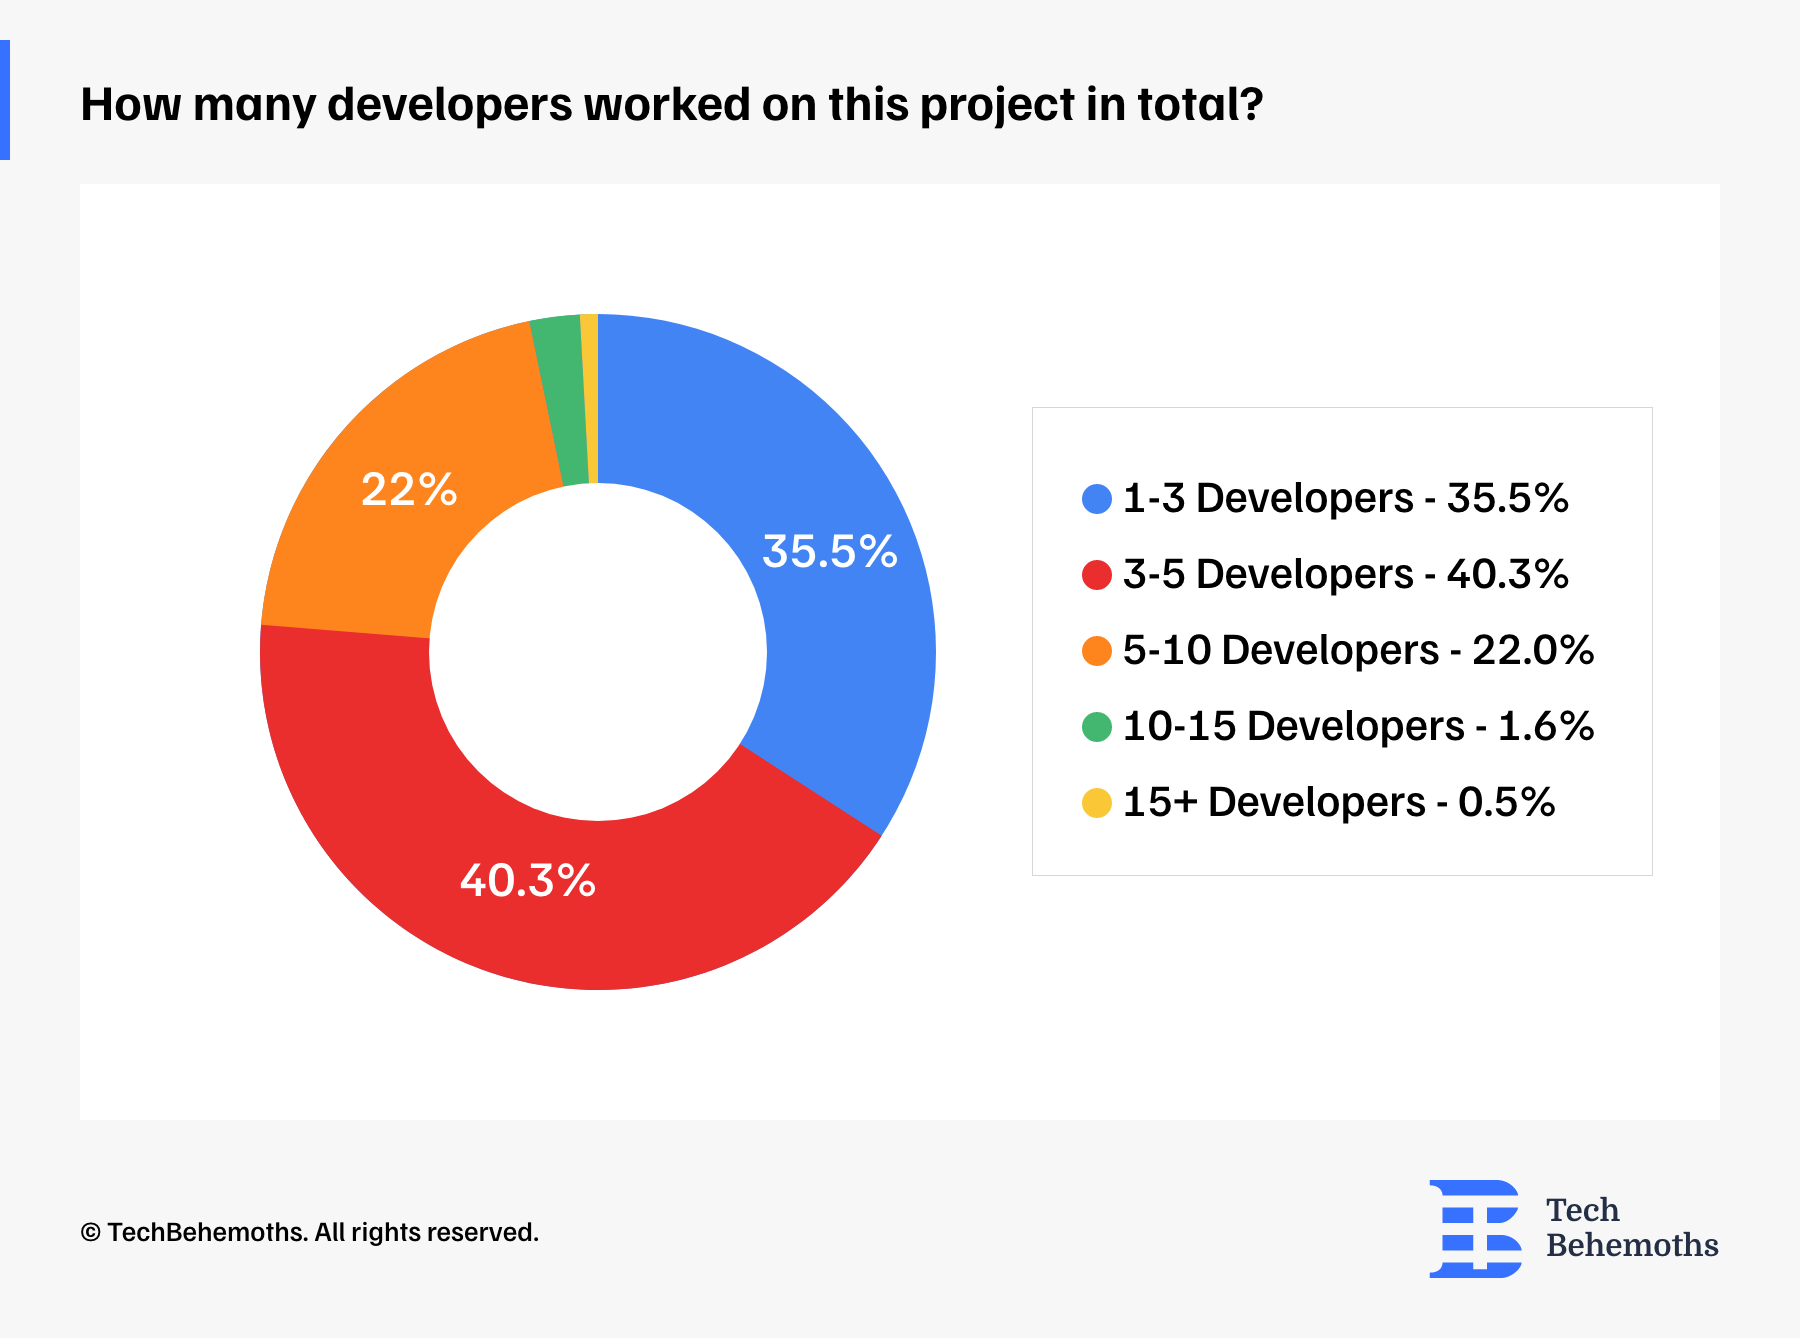
Very few projects necessitated larger teams, with only 1.6% of apps being developed by teams of 10 to 15 developers, and a mere 0.5% exceeding 15 developers, which is indicative of large-scale or highly specialized app development endeavors. The data presents a clear inclination towards small to medium-sized development teams in the mobile app industry, aligning with agile development practices and the capacity to effectively manage and execute projects within such team structures.
Costs associated with third-party tools in Mobile App Development
In terms of paid third-party tools for mobile app development, the survey respondents data show that 78.4% of companies spend less than $1,000 on third-party tools, indicating that the majority of mobile app developers either rely on free tools, benefit from low-cost solutions, or have access to a suite of tools that require minimal investment. This could also reflect proficiency in utilizing open-source resources or in-house tools that diminish the need for additional spending.
In contrast, a smaller portion of developers incur higher costs, with 10.8% of respondents spending between $1,000 to $3,000, which suggests that certain projects necessitate more specialized, premium tools to achieve desired functionalities or performance. An even smaller subset, 6.5% of the developers, report spending between $3,000 to $5,000, highlighting that as the complexity of the app increases, so does the need for more advanced or numerous third-party tools.
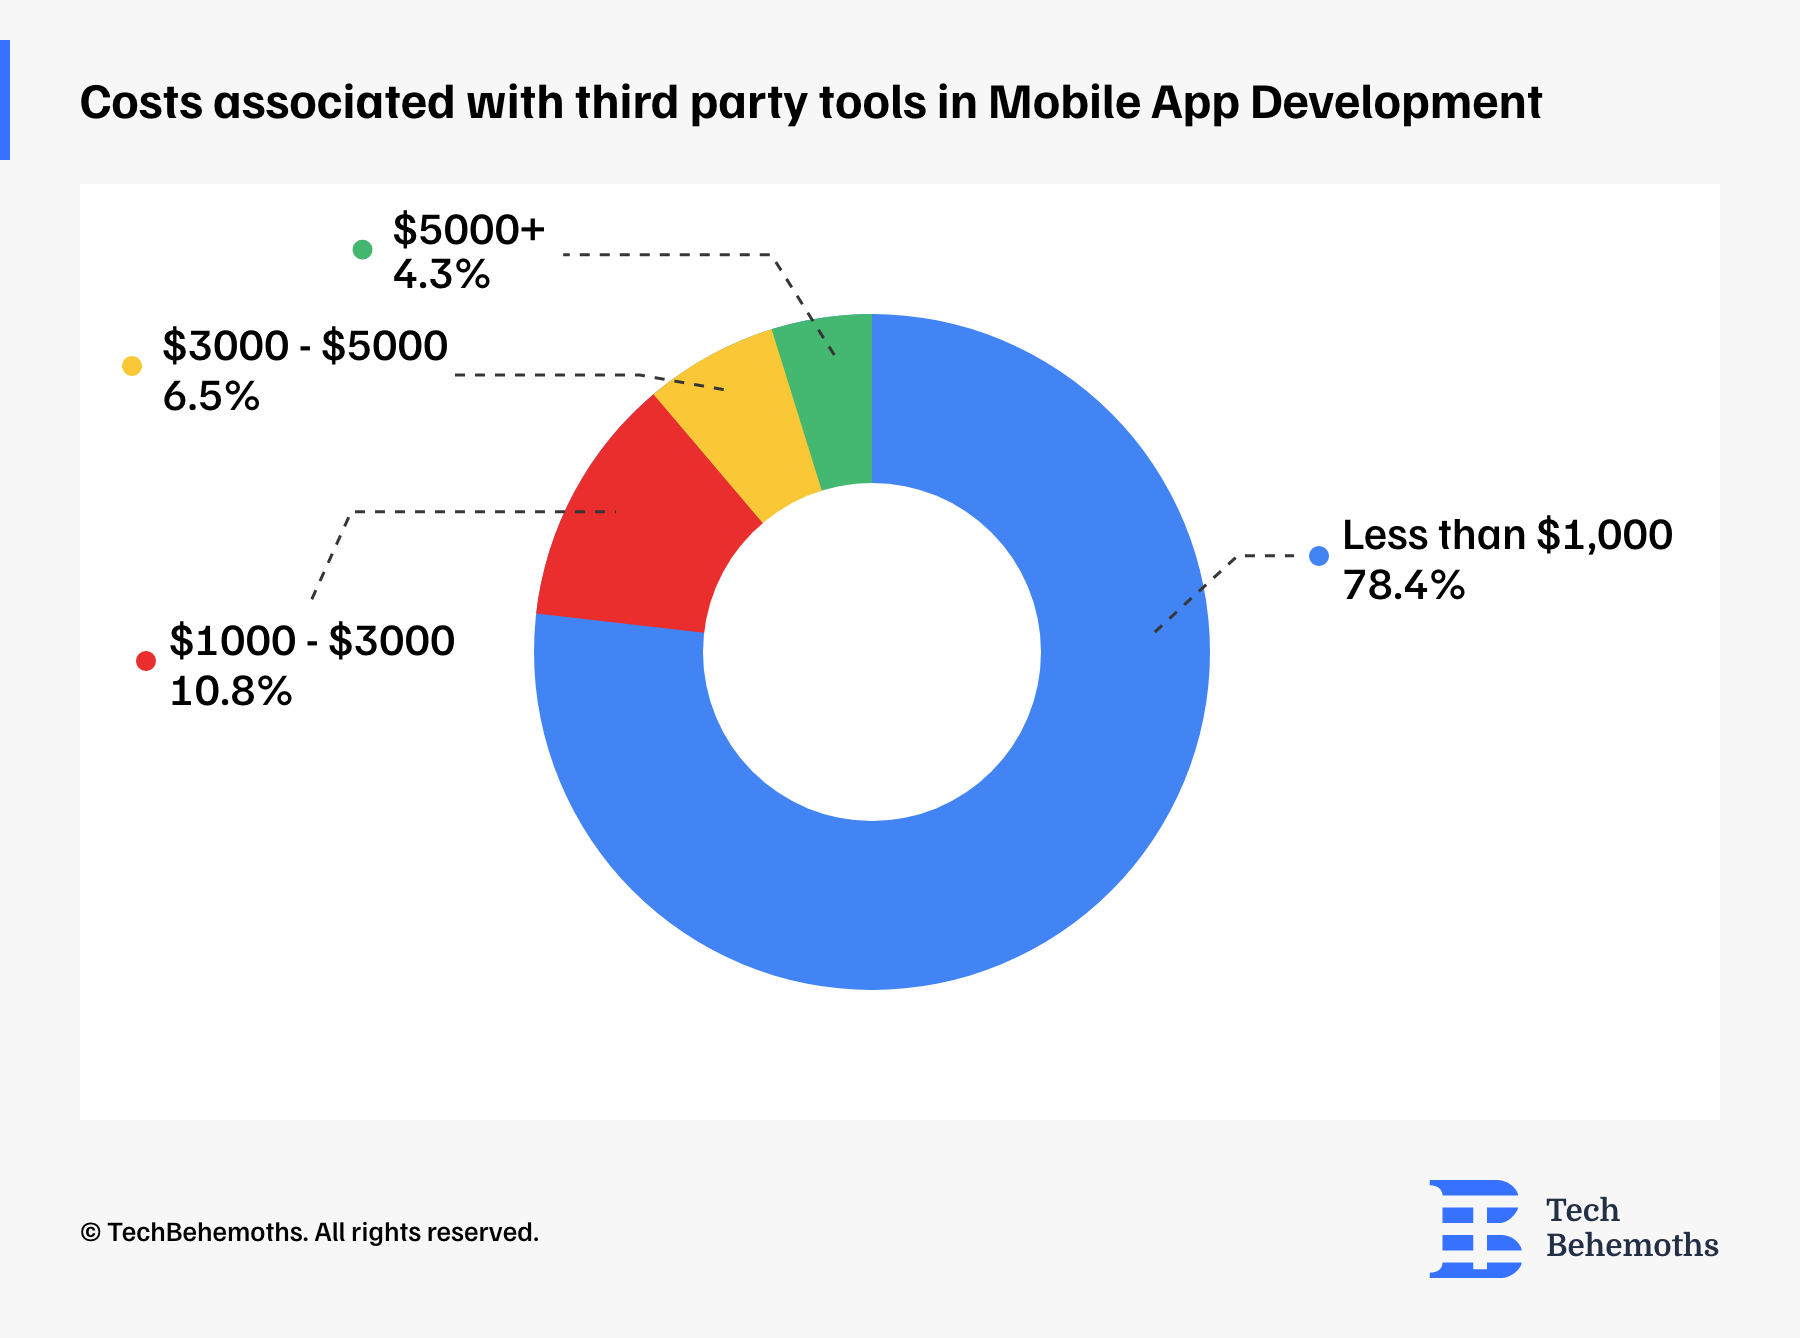
In the end, only 4.3% of mobile app development companies revealed that their spending exceeds $5,000, underscoring that significant investments in third-party tools are relatively uncommon. This could point to the development of highly specialized apps or the usage of premium services that offer unique capabilities, which are not as widely required across typical app development scenarios.
Methodologies Used in Mobile App Development
The distribution of methodologies used in mobile app development shows that Agile is the most prevalent, with 59.1% of developers adopting its principles, which highlight iterative development, collaborative efforts, and flexibility to changes. This suggests that a significant majority of mobile app developers prioritize Agile's adaptability and customer-centric approach to rapidly evolve products in response to user feedback and changing market demands.
Scrum, a subset of Agile that focuses on time-boxed iterations and roles like Scrum Master and Product Owner, is also relatively popular, used by 12.4% of developers. This reflects a structured yet flexible approach to project management and underscores the importance of regular reviews and adjustments during the app development process.
The hybrid methodology is employed by 10.8% of mobile app developers, offering a balanced approach that combines the flexibility of Agile with the structure of traditional models.
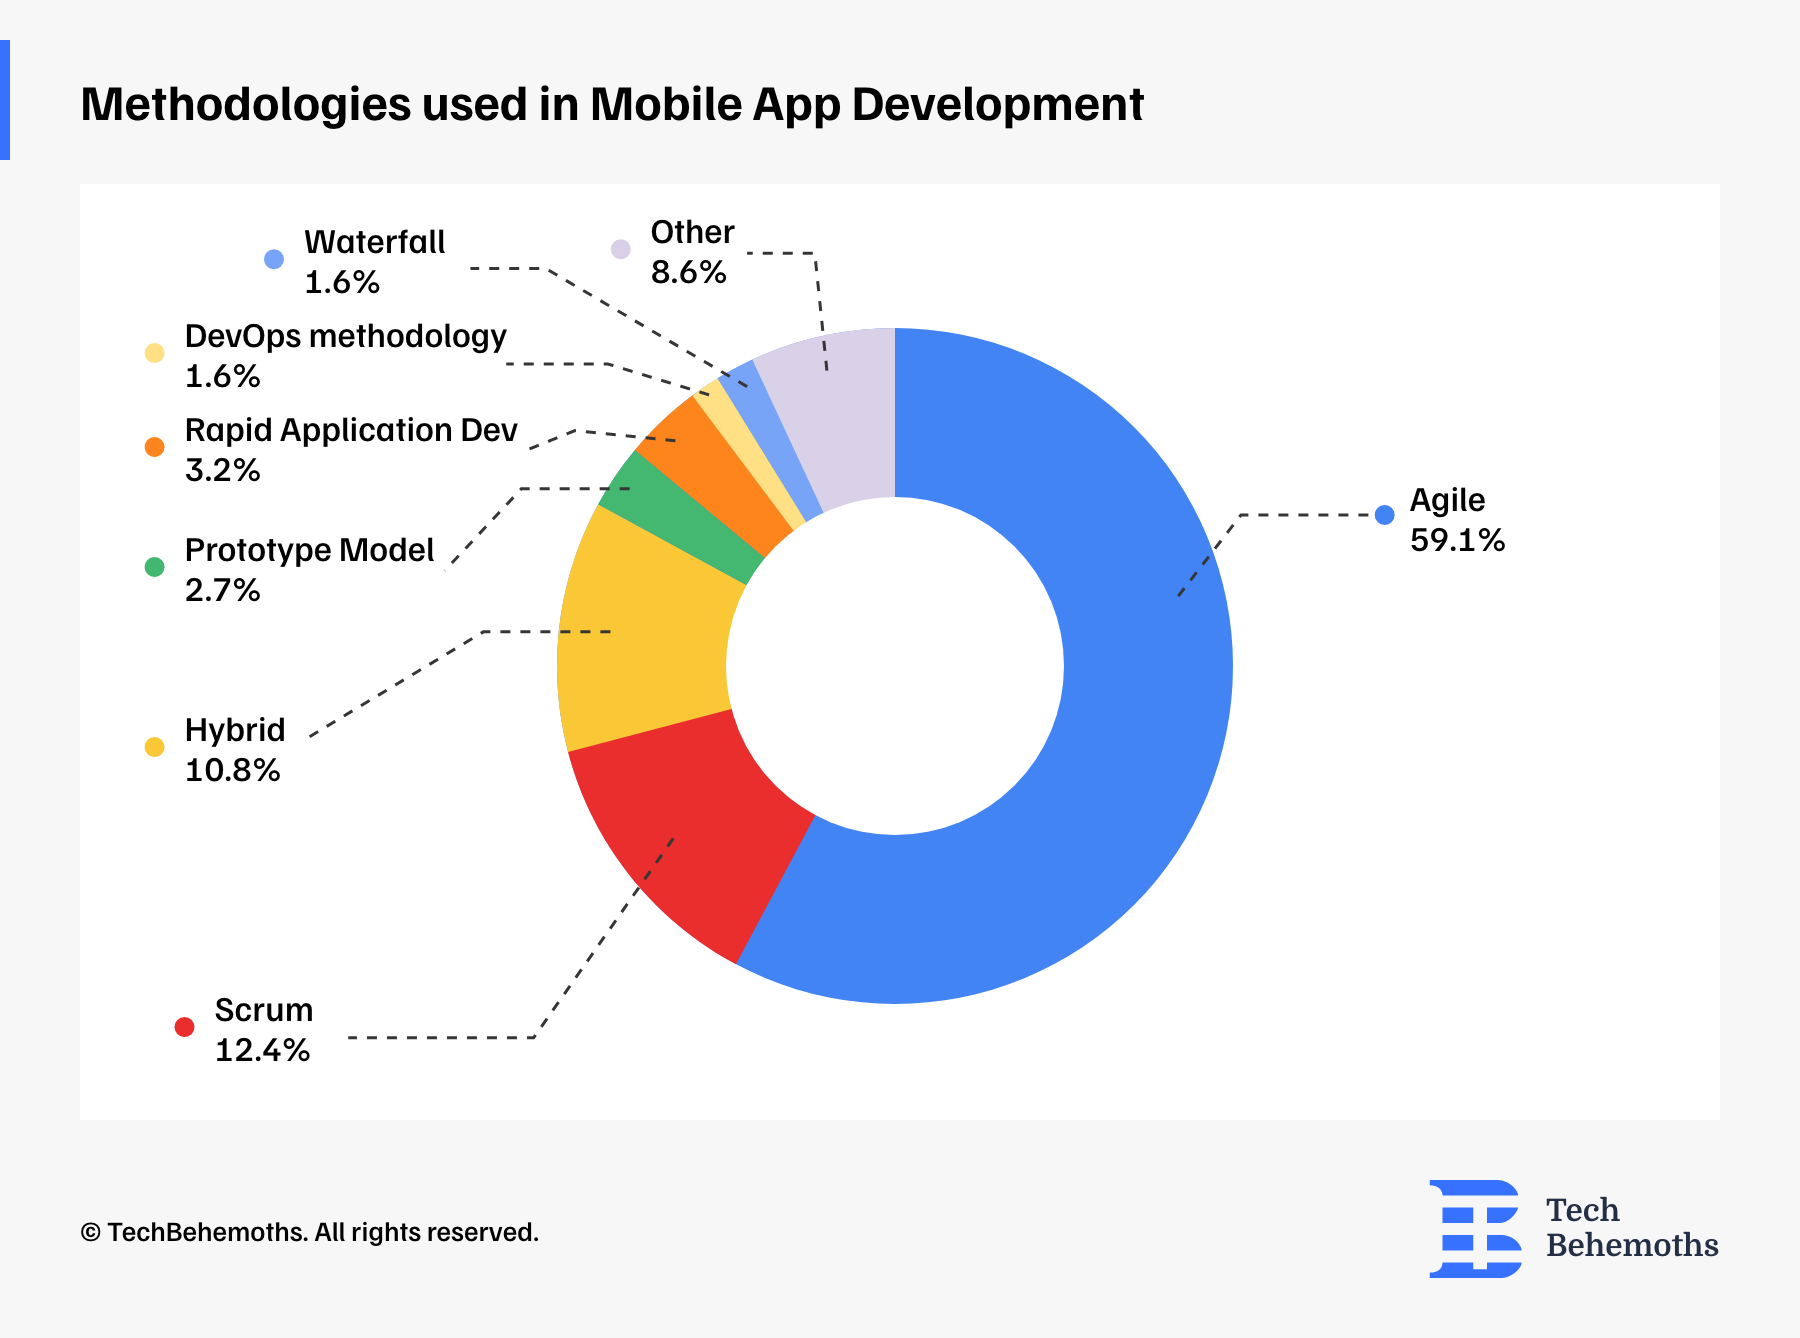
On the other hand, traditional methodologies like Waterfall are used by a much smaller fraction of developers, only 1.6%, indicating that the sequential and less flexible nature of Waterfall is less favored in the dynamic environment of mobile app development. Similarly, the DevOps methodology, which emphasizes continuous delivery and integration, accounts for 1.6%, suggesting that while its practices are recognized, they are not as widespread in mobile app development compared to other tech sectors.
Rapid Application Development (RAD) and the Prototype Model, both of which focus on quick iterations and early prototyping, are used by 2.3% and 2.7% of developers, respectively. These methods likely cater to projects with tight deadlines or the need for early market validation. A Hybrid approach, which combines elements from different methodologies, is preferred by 10.8% of developers, indicating a tailored approach to best suit project-specific needs.
Communication and Project Management Tools Used by Mobile App Development Companies
The results on this topic show the communication and project management tools among mobile app development companies.
Slack emerges as the most popular tool, with 74.4% of companies utilizing it. This high adoption rate underscores Slack's effectiveness in fostering team communication and its integration capabilities with other development tools. Jira follows with 55.9%, indicating a strong preference for its issue tracking and agile project management features, which are essential for software development processes.
Zoom is the preferred tool for 42.5% of the respondents, reflecting its pivotal role in remote communication, especially for meetings and discussions that require real-time collaboration. Trello and Microsoft Teams are used by nearly a quarter of the companies, 24.7% and 24.2% respectively, suggesting that visual task management and integrated team environments are key to managing mobile app development projects.
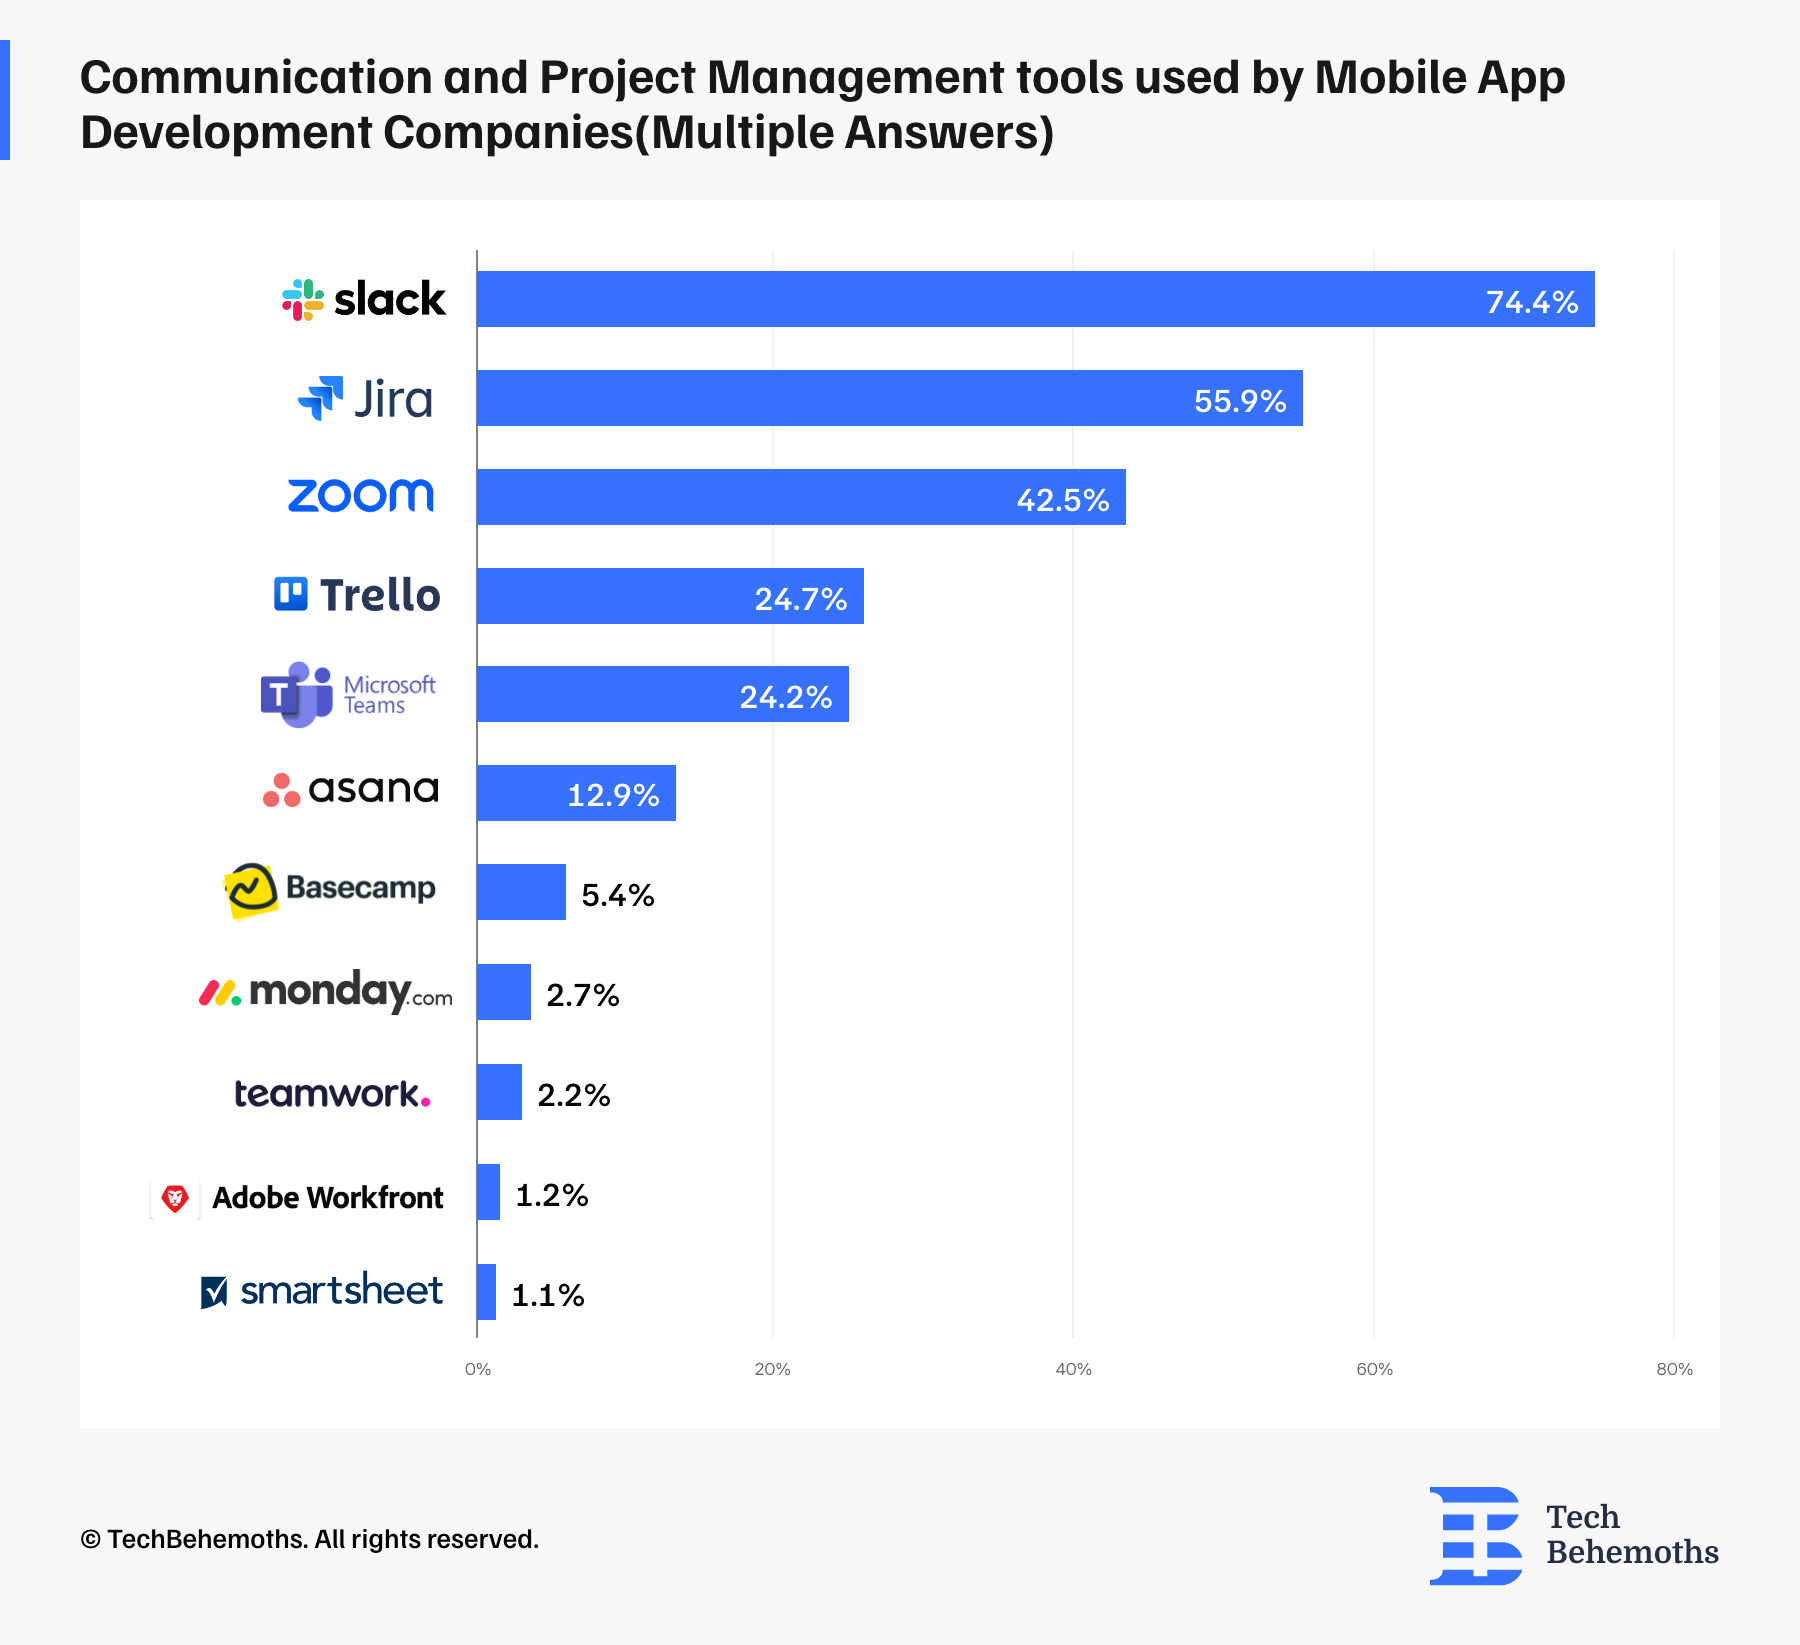
Asana, which is known for workflow management and task organization, is utilized by 12.9% of the respondents. Basecamp and Monday.com, which provide project organization and tracking, are less common, with 5.4% and 2.7% usage respectively, while Teamwork and Adobe Workfront have an even smaller user base of 2.2% and 1.1% respectively, possibly due to their niche or specialized features.
Smartsheet, known for its spreadsheet-like interface for task management, is at the bottom with 1.2% usage. The varied usage of these tools reflects a range of preferences and requirements within the industry, with mobile app development companies opting for a mix of tools that best fit their communication and project management needs.
How companies ensure the quality of the app throughout the development process
When it comes to testing, the survey respondents revealed multiple approaches regarding the way the app quality is ensured during the development process.
The survey results show that Manual Testing is the most widely used method, with 79% of companies incorporating it into their quality assurance process. This indicates that despite the advancements in automated testing, manual testing remains crucial, likely due to its effectiveness in identifying usability issues and providing a real-user perspective.
User Testing follows, with 62% of companies utilizing this method. This reflects the importance placed on user feedback and the need to understand the user experience deeply, ensuring that the app meets the target audience's expectations and needs.
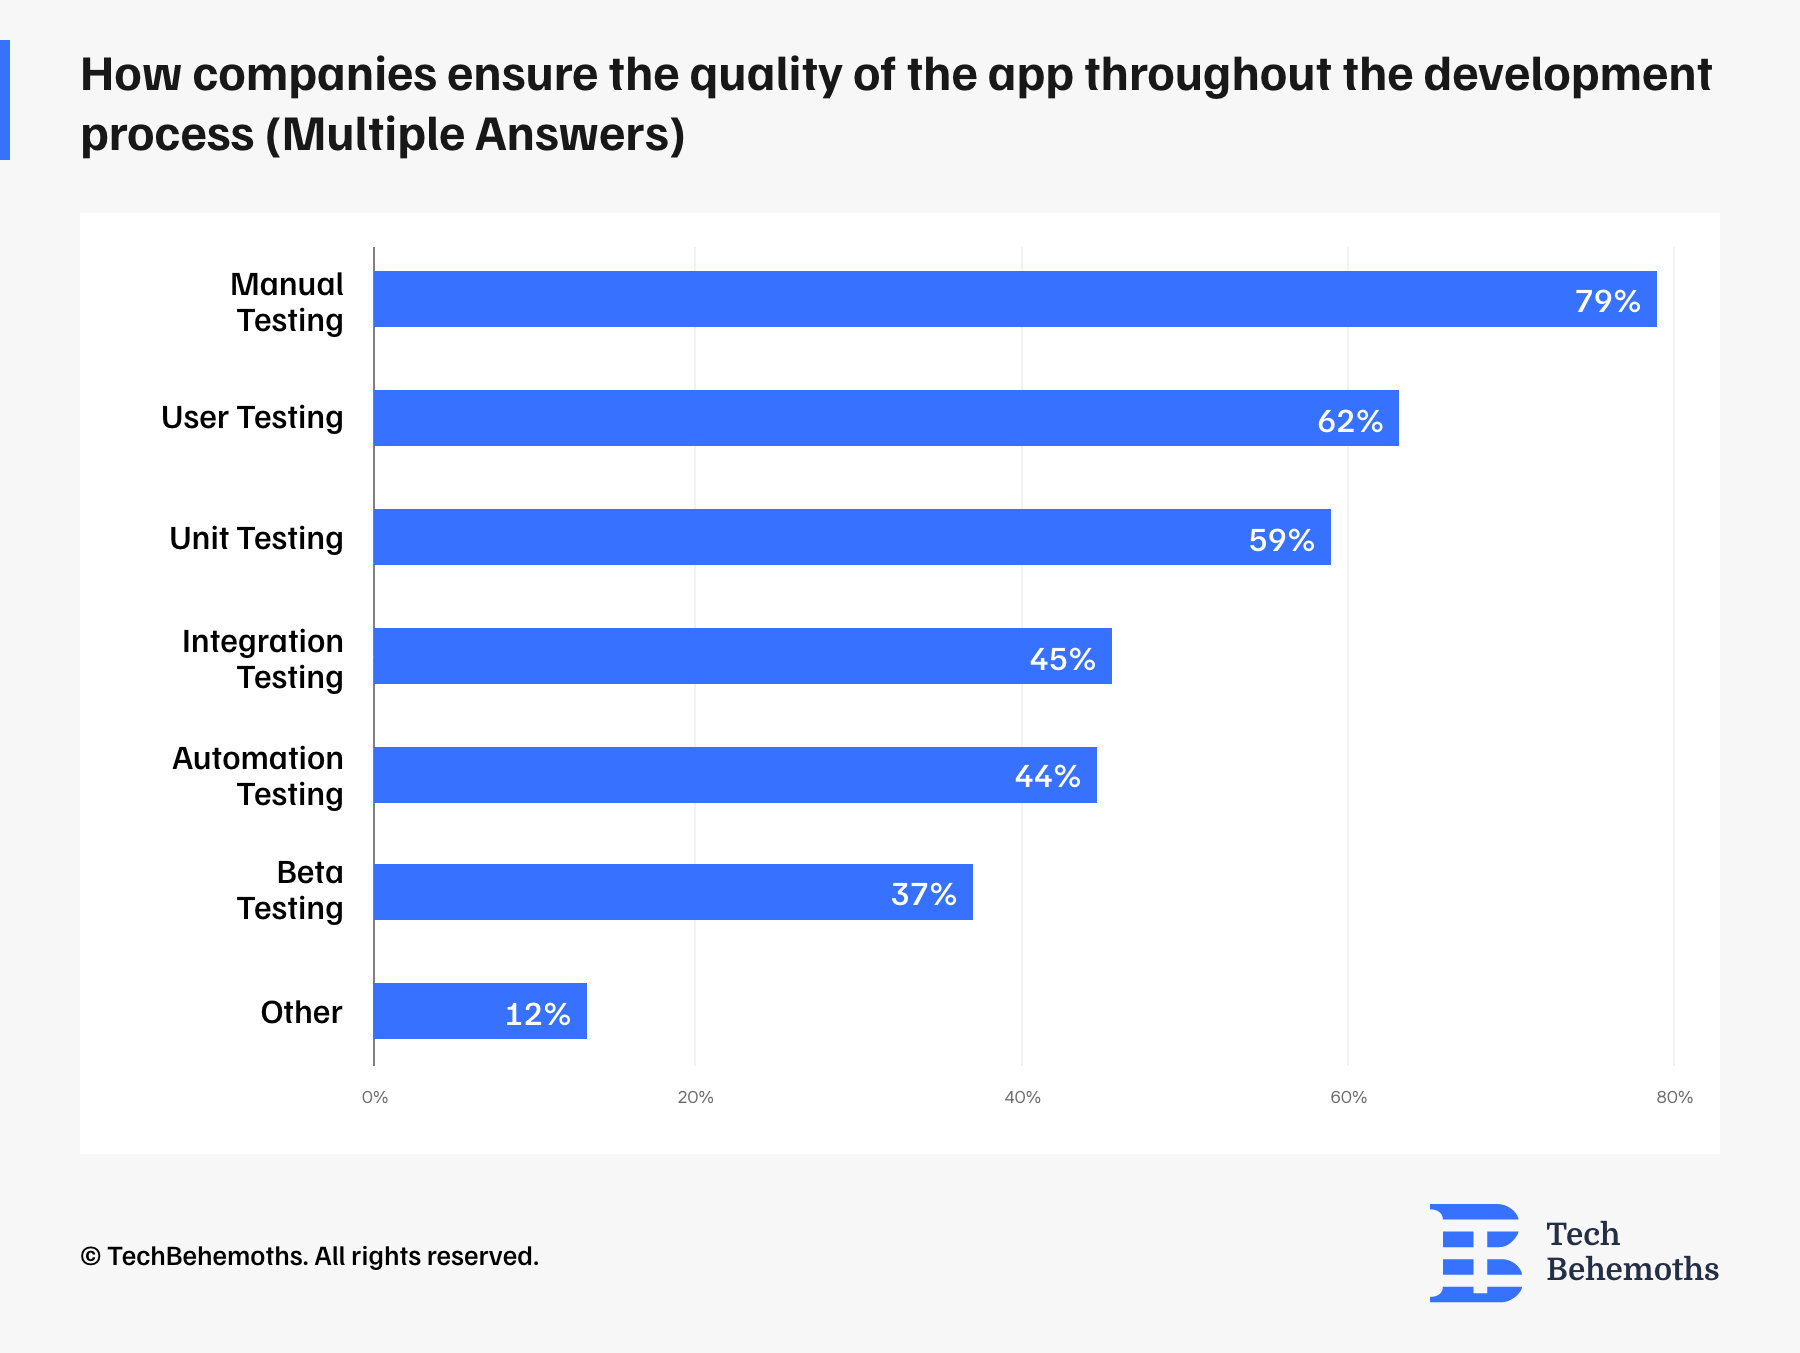
Unit Testing is employed by 59% of companies, which points to a strong focus on verifying the individual components of the application for functionality, reliability, and performance. Integration Testing and Automation Testing are also significant, with 45% and 44% usage respectively. This suggests that companies are investing in testing the interactions between integrated units and leveraging automation to streamline the testing process, enhancing efficiency and coverage.
Beta Testing is utilized by 37% of companies, indicating a strategic approach to releasing the app to a limited audience before the full launch to detect potential issues and gather user feedback.
Lastly, the 'Other' category, comprising 12% of the responses, may include less common or specialized testing methods that are not explicitly mentioned but are nonetheless part of the companies' quality assurance strategies
Maintenance and Bug Fixes
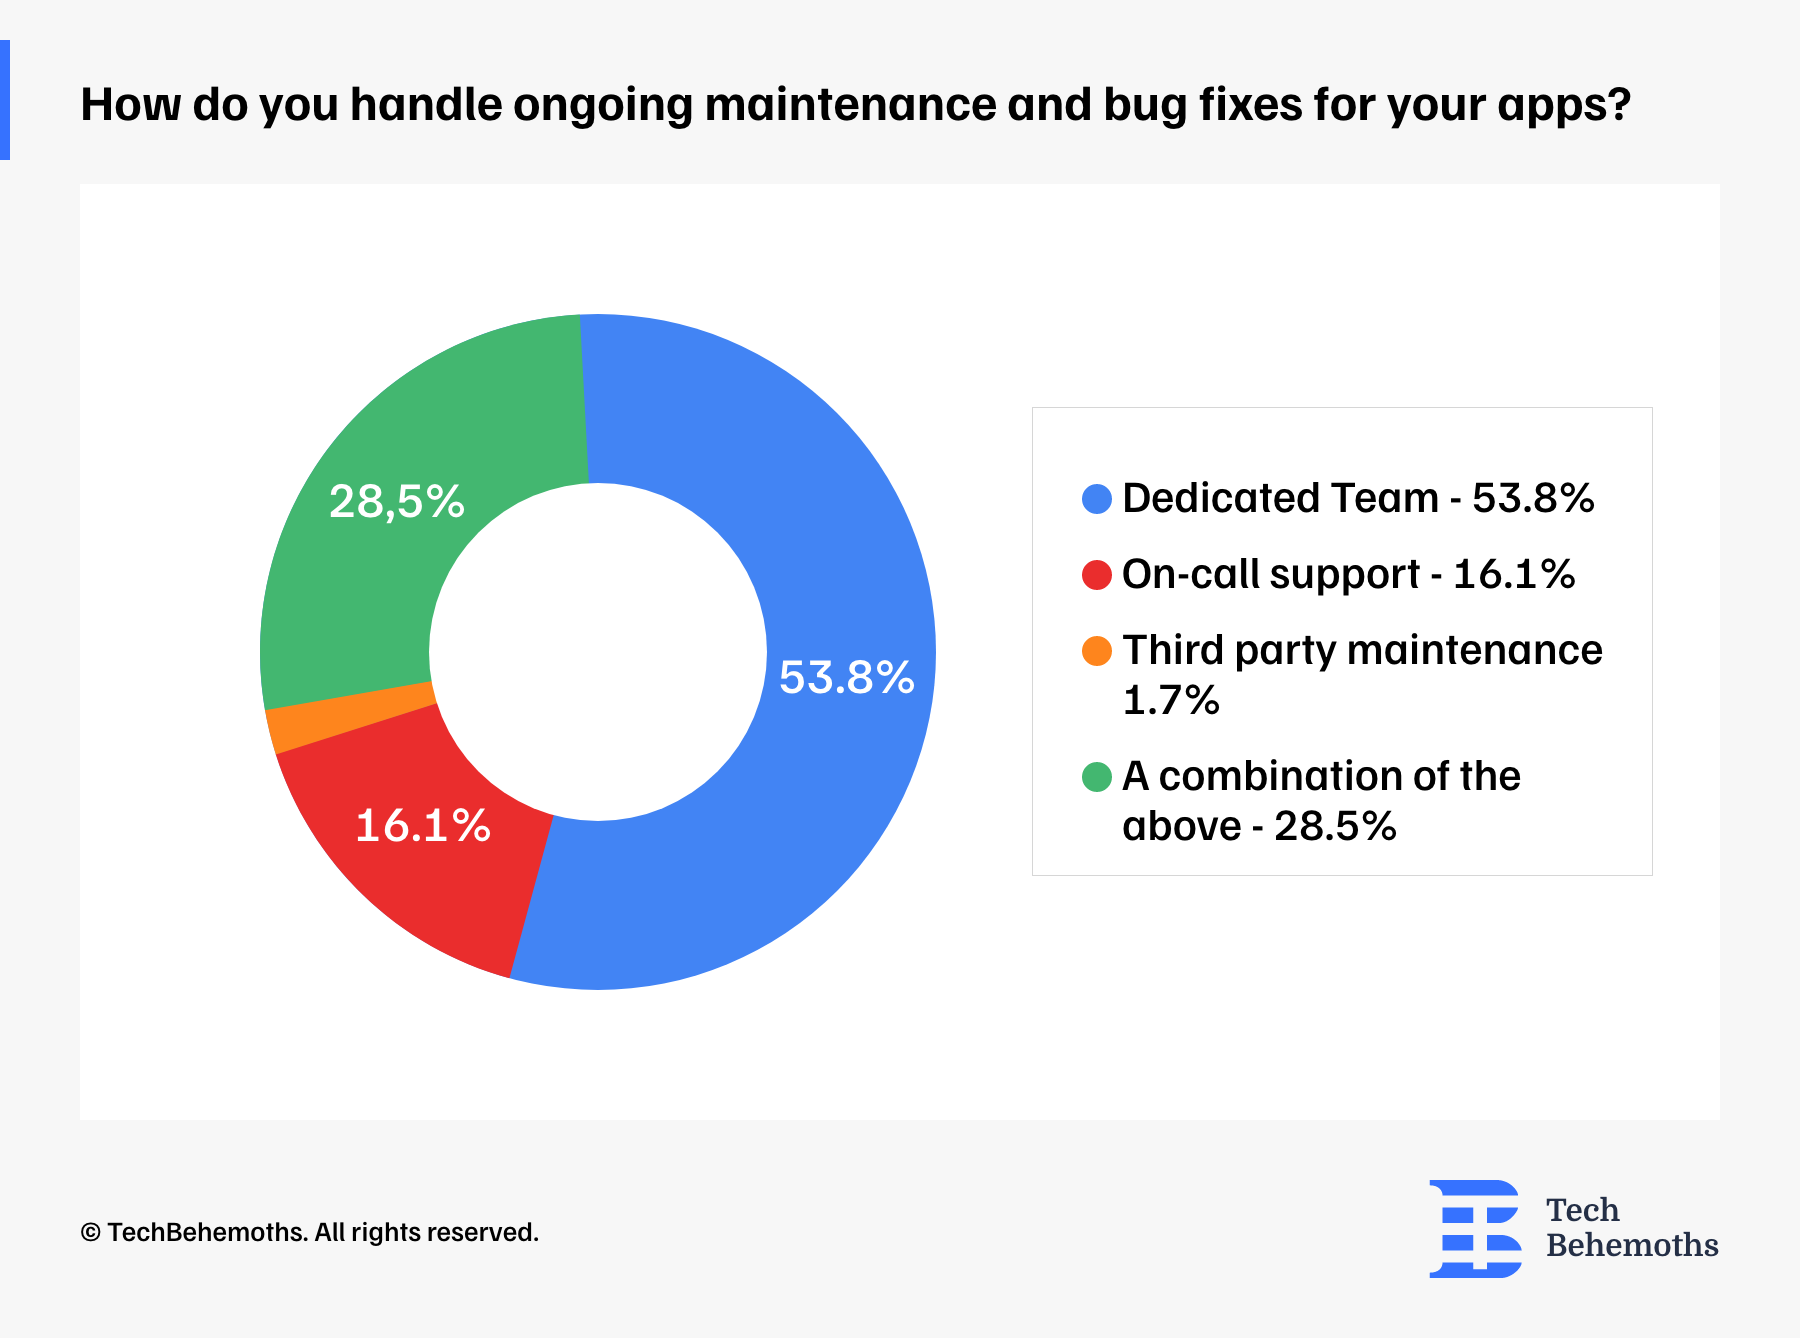
When it comes to bug fixing and maintenance, mobile app development companies participating in this survey declared that more than half of companies have a dedicated team to tackle these challenges - 53.8%
At the same time, 16.1% of companies declared that they provide on-call support, and 28% mix both on-call support and a dedicated team.
Only 1.7% of respondents declared that they outsource the maintenance of their apps through third parties.
However, we have to mention that the results are global, and at a national level, some countries the ration between these options could vary.
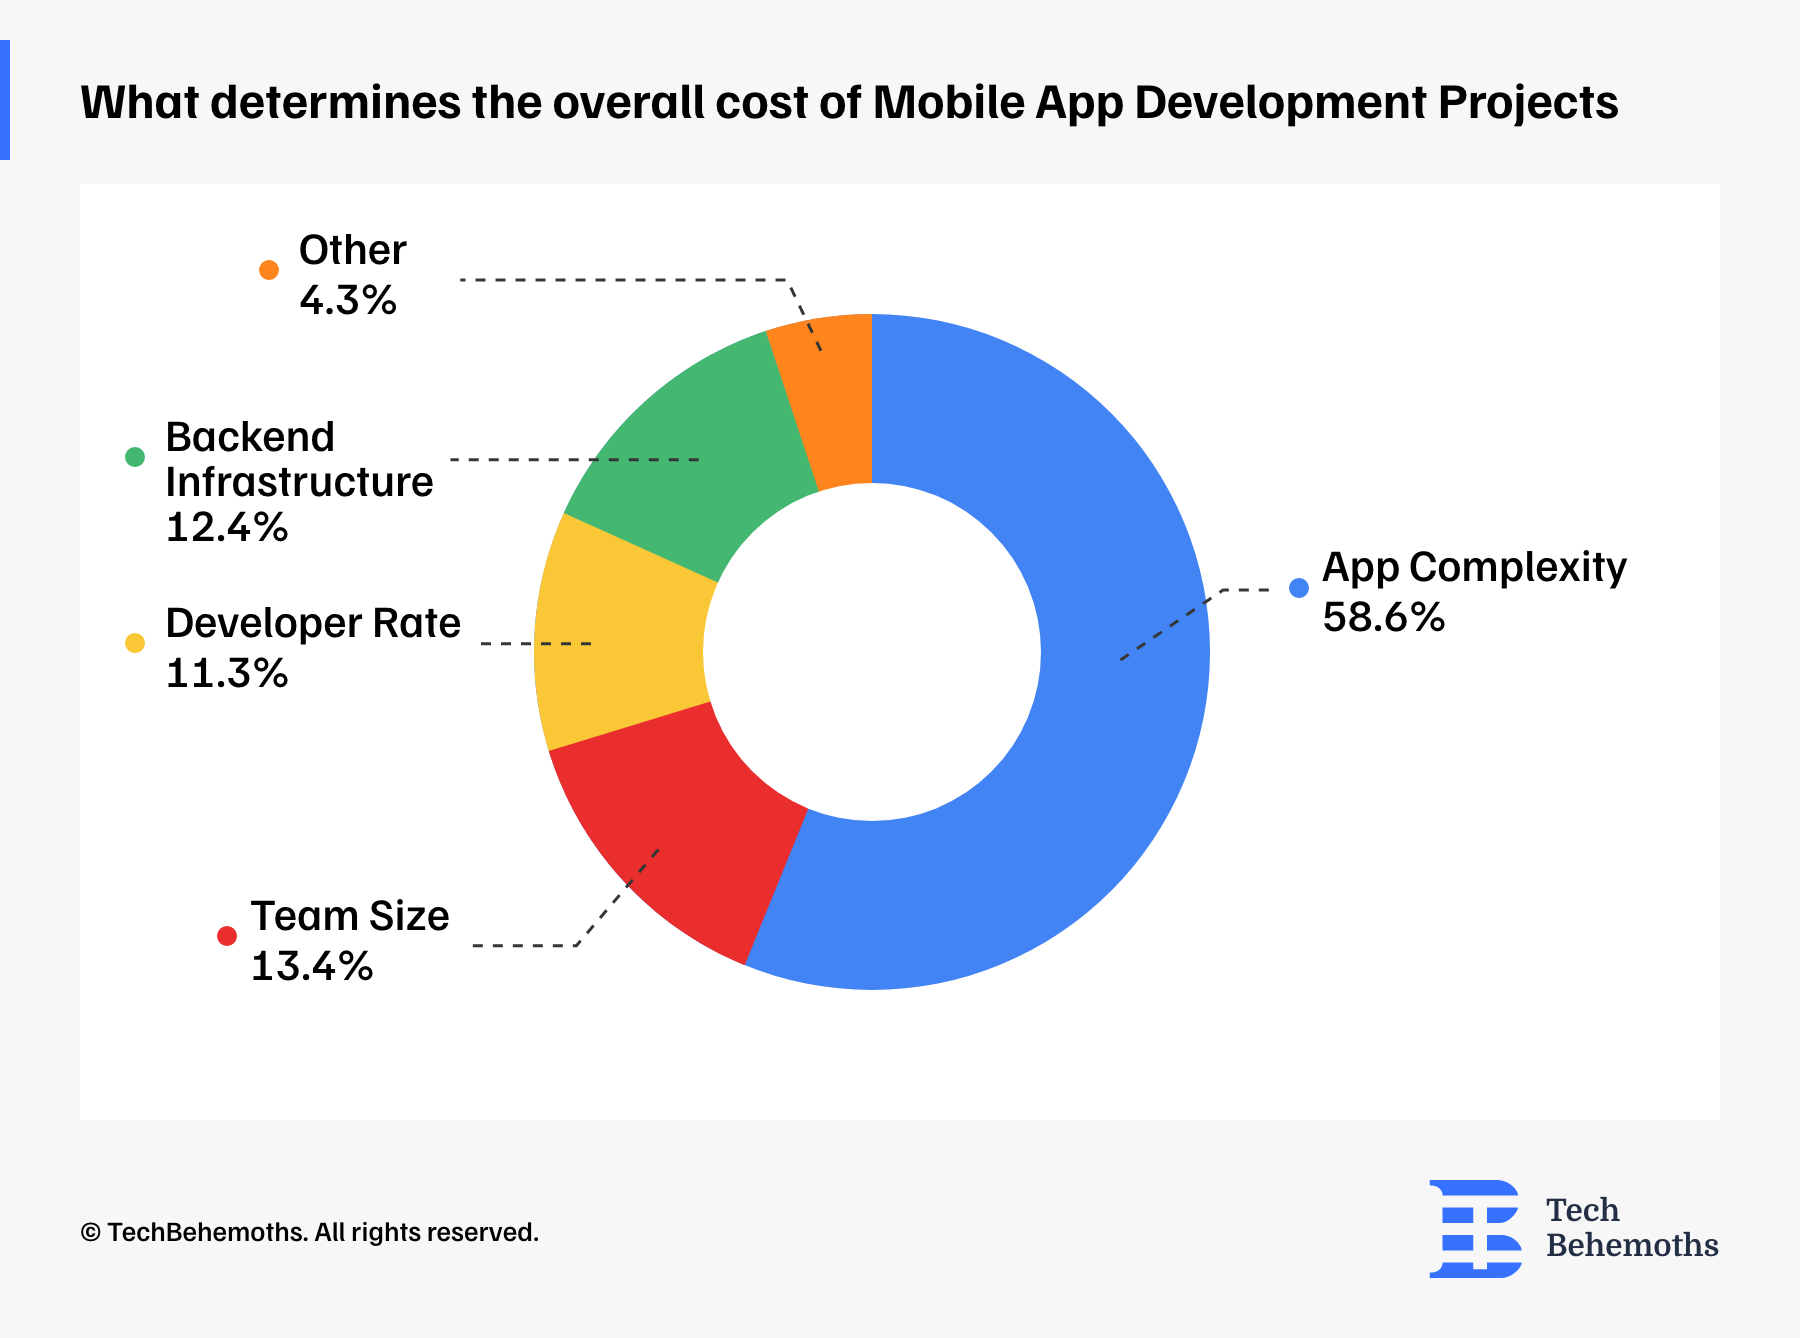
What determines the overall cost of Mobile App Development Projects
Next, let’s take a look at what are the main factors that determine the cost of mobile app development. So, even at the first look things seem pretty clear, the truth behind shows a variety of reasons and multiple factors.
58.6% of surveyed companies declared that App complexity is the main reason based on which they decide the price. This is followed by Team size - 13.4% and Backend infrastructure - 12.4%. Lastly, the developer’s rate has been declared as the most important factor to determine the project cost only by 11.3%.
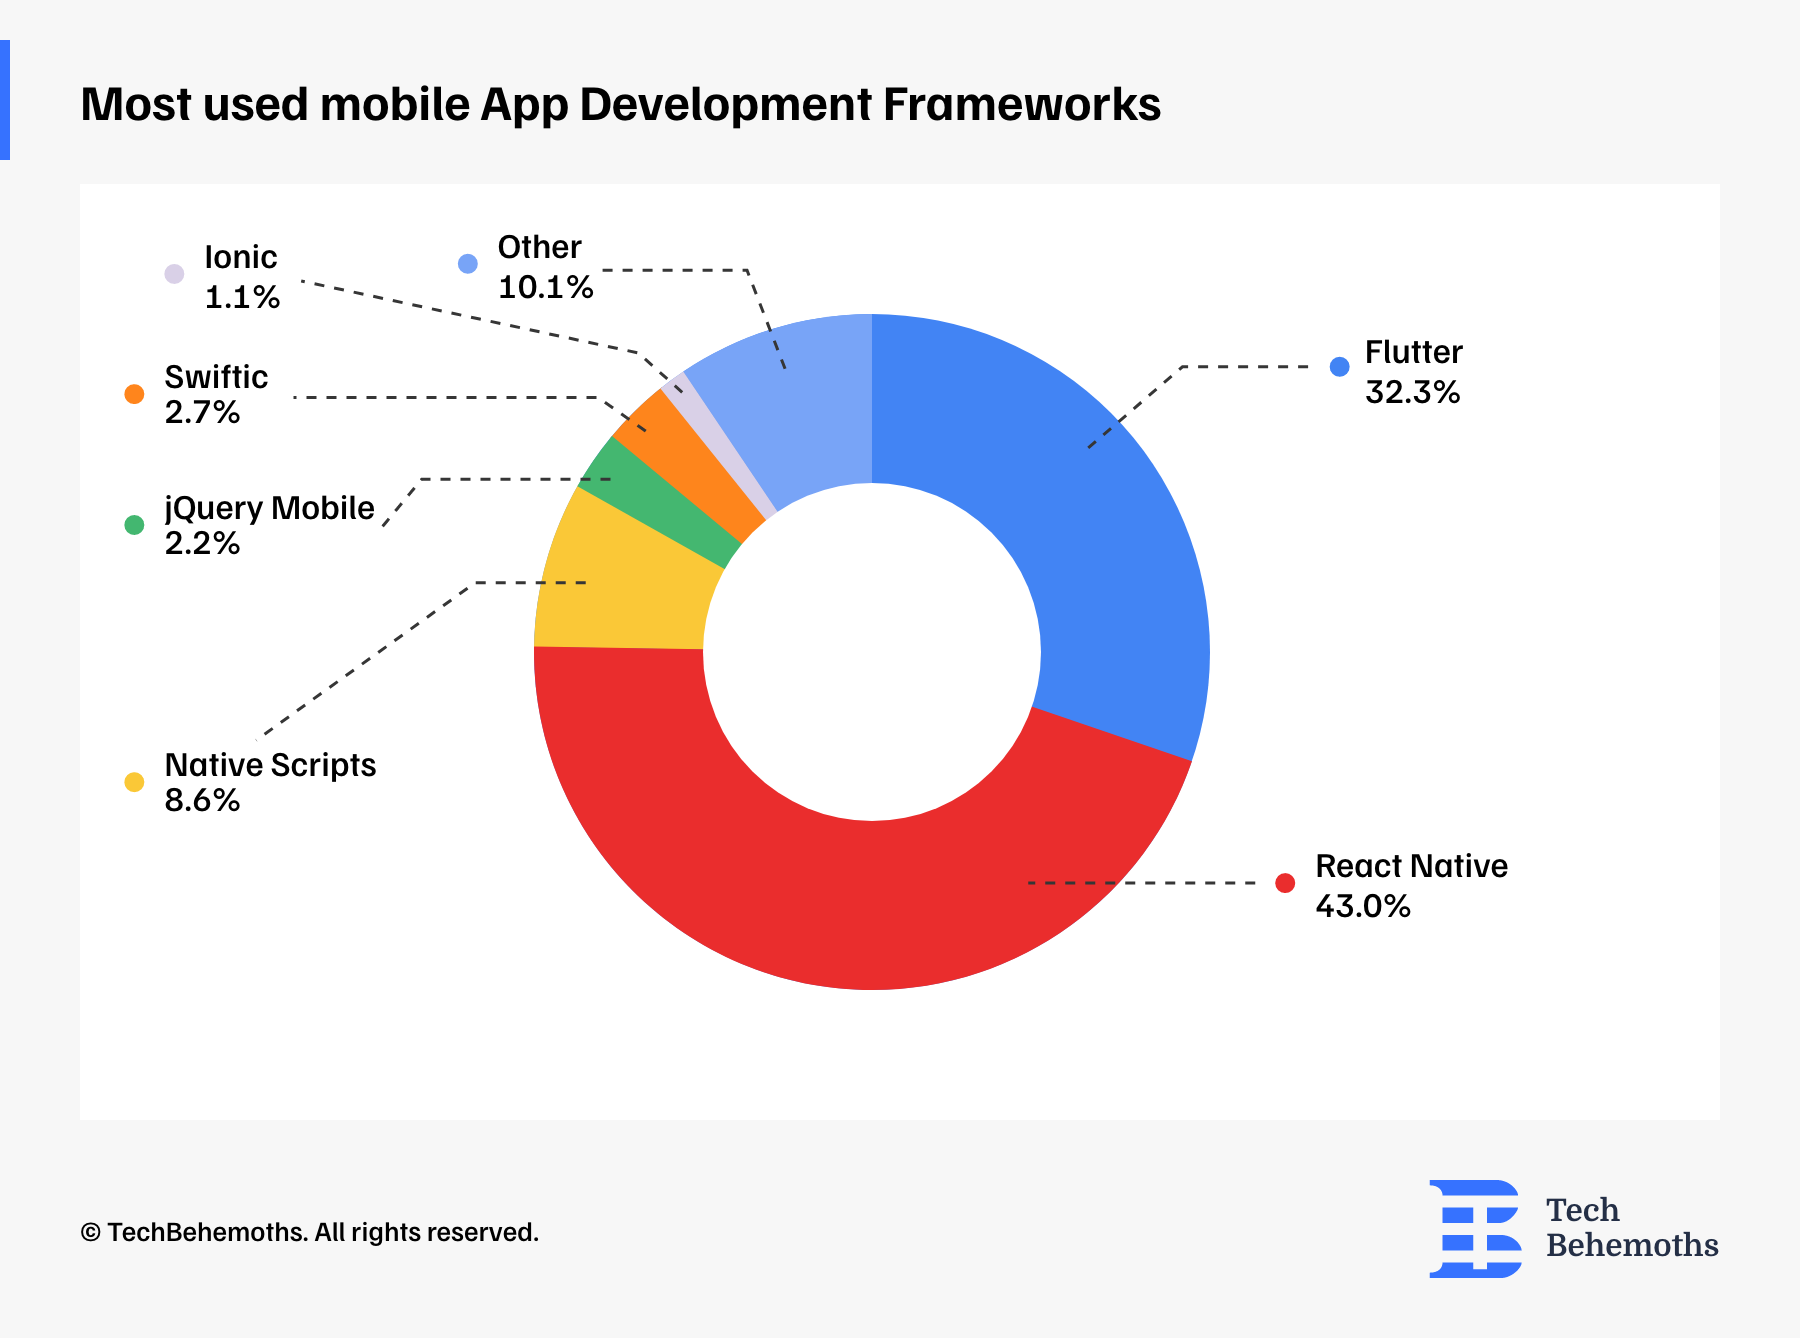
Most Used Mobile App Development Frameworks
Regarding the most used mobile app development frameworks by companies, survey respondents have declared that:
-
43% of them use React native
-
32.3% of respondents, are using Flutter
-
Native scripts has a rate of 8.6%
-
jQuerry Mobile is used by 2.2%
-
Swiftic - 2.7% of respondents
-
And Ionic - only 1.1%
Other 10.1% of respondents declared that they use other frameworks, which have a lower share compared to the least popular one listed above.
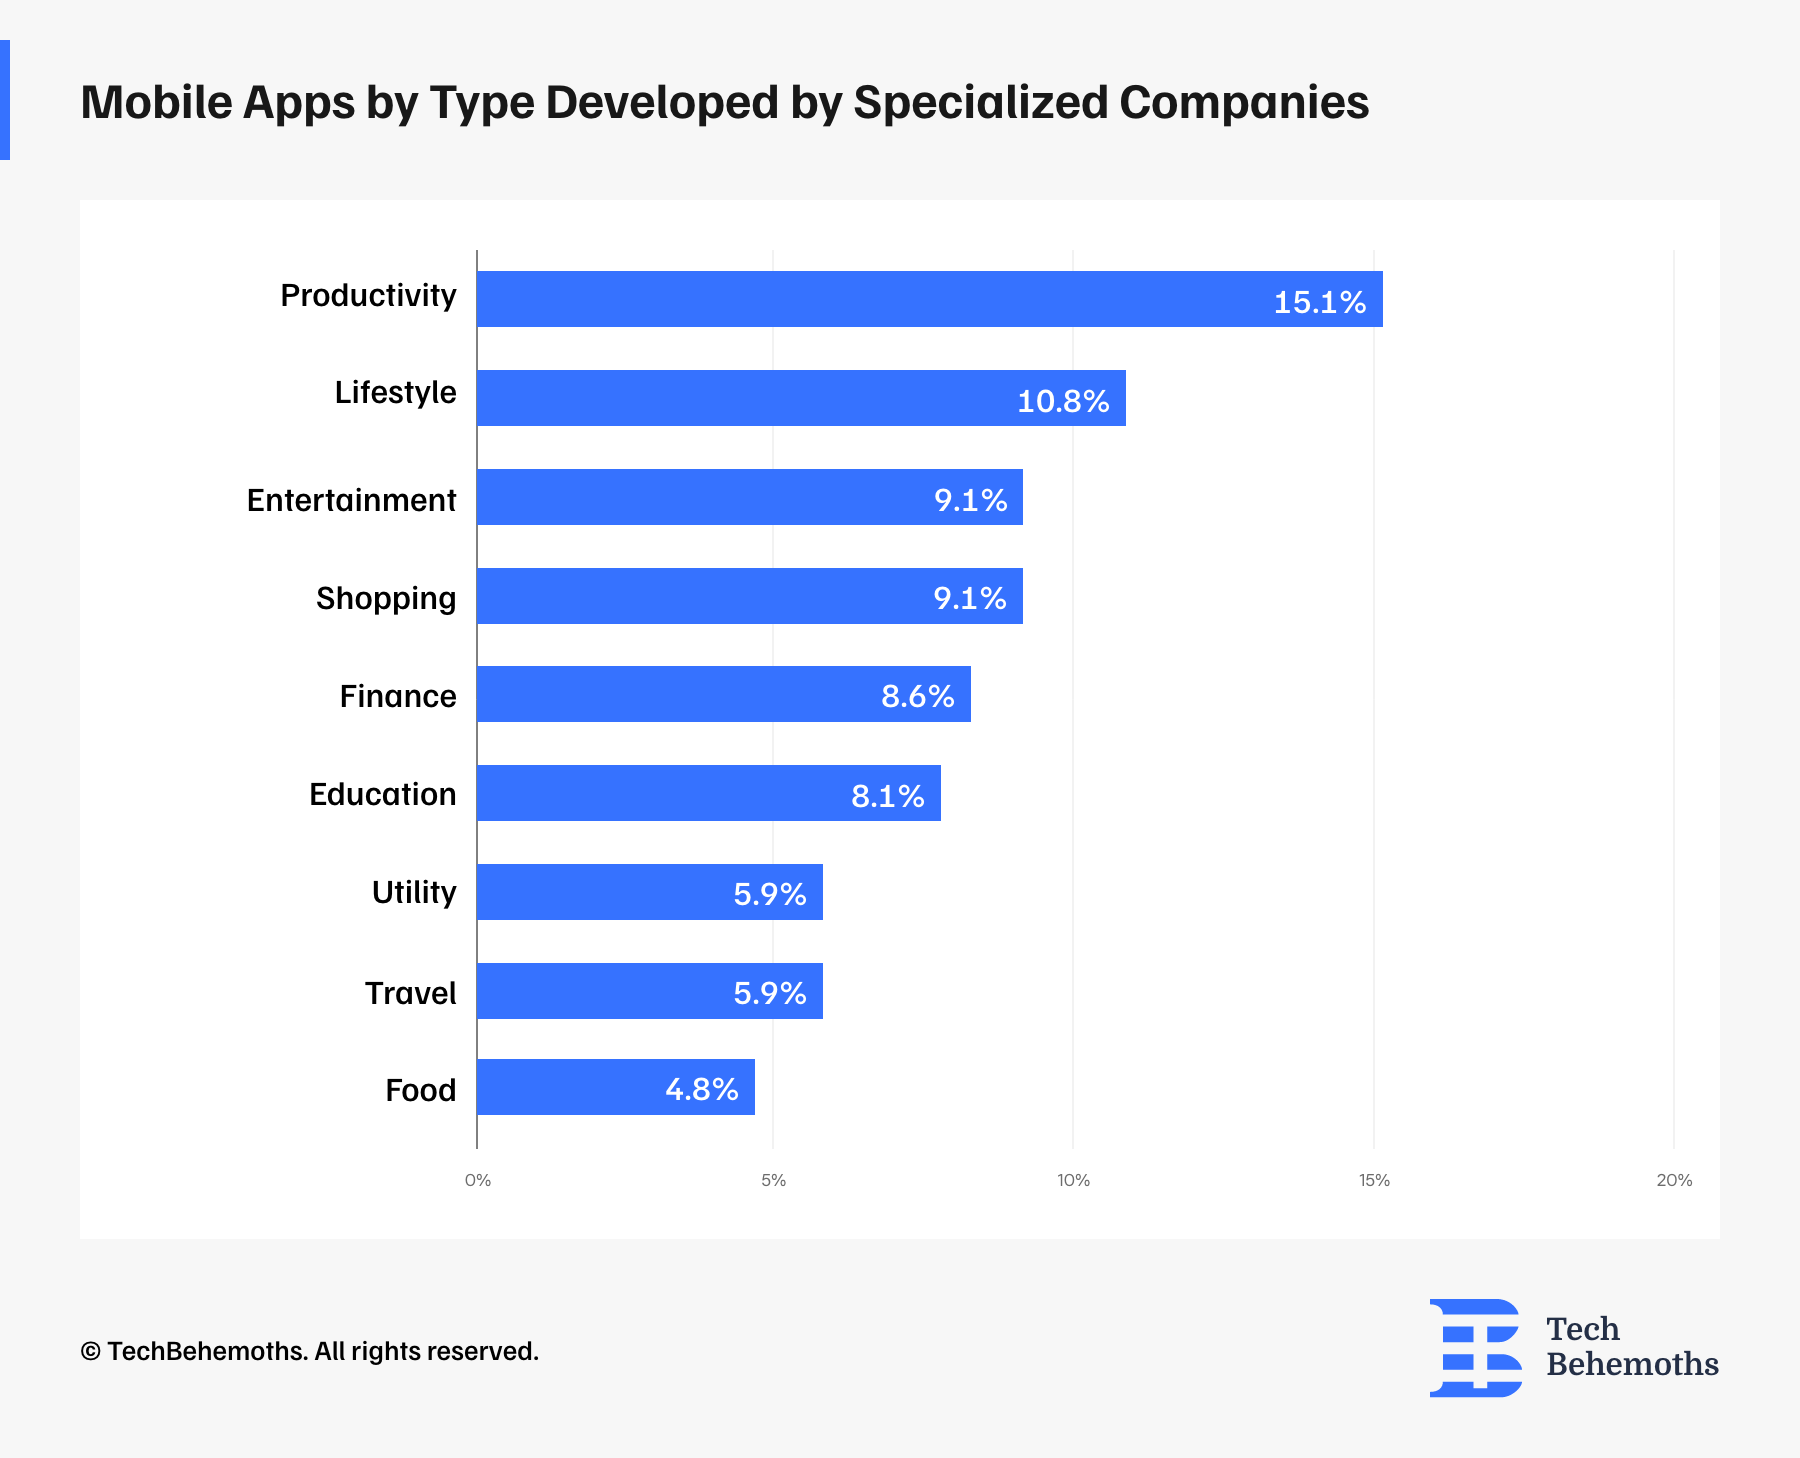
Mobile Apps by Type Developed by Specialized Companies
The survey results show that the distribution of mobile app types is uneven, with multiple options being close as a ratio. In this way, the respondents declared that 15.1% of the apps fit in the productivity category, followed by Lifestyle apps with 10.8%.
Entertainment apps and shopping apps are next in the line with 9.1% each. Finance and educational apps have a share of 8.6 and 8.1% respectively, while Utility and Travel apps have a 5.9% share each. The least popular app category proved to be Food apps, with 4.8%.
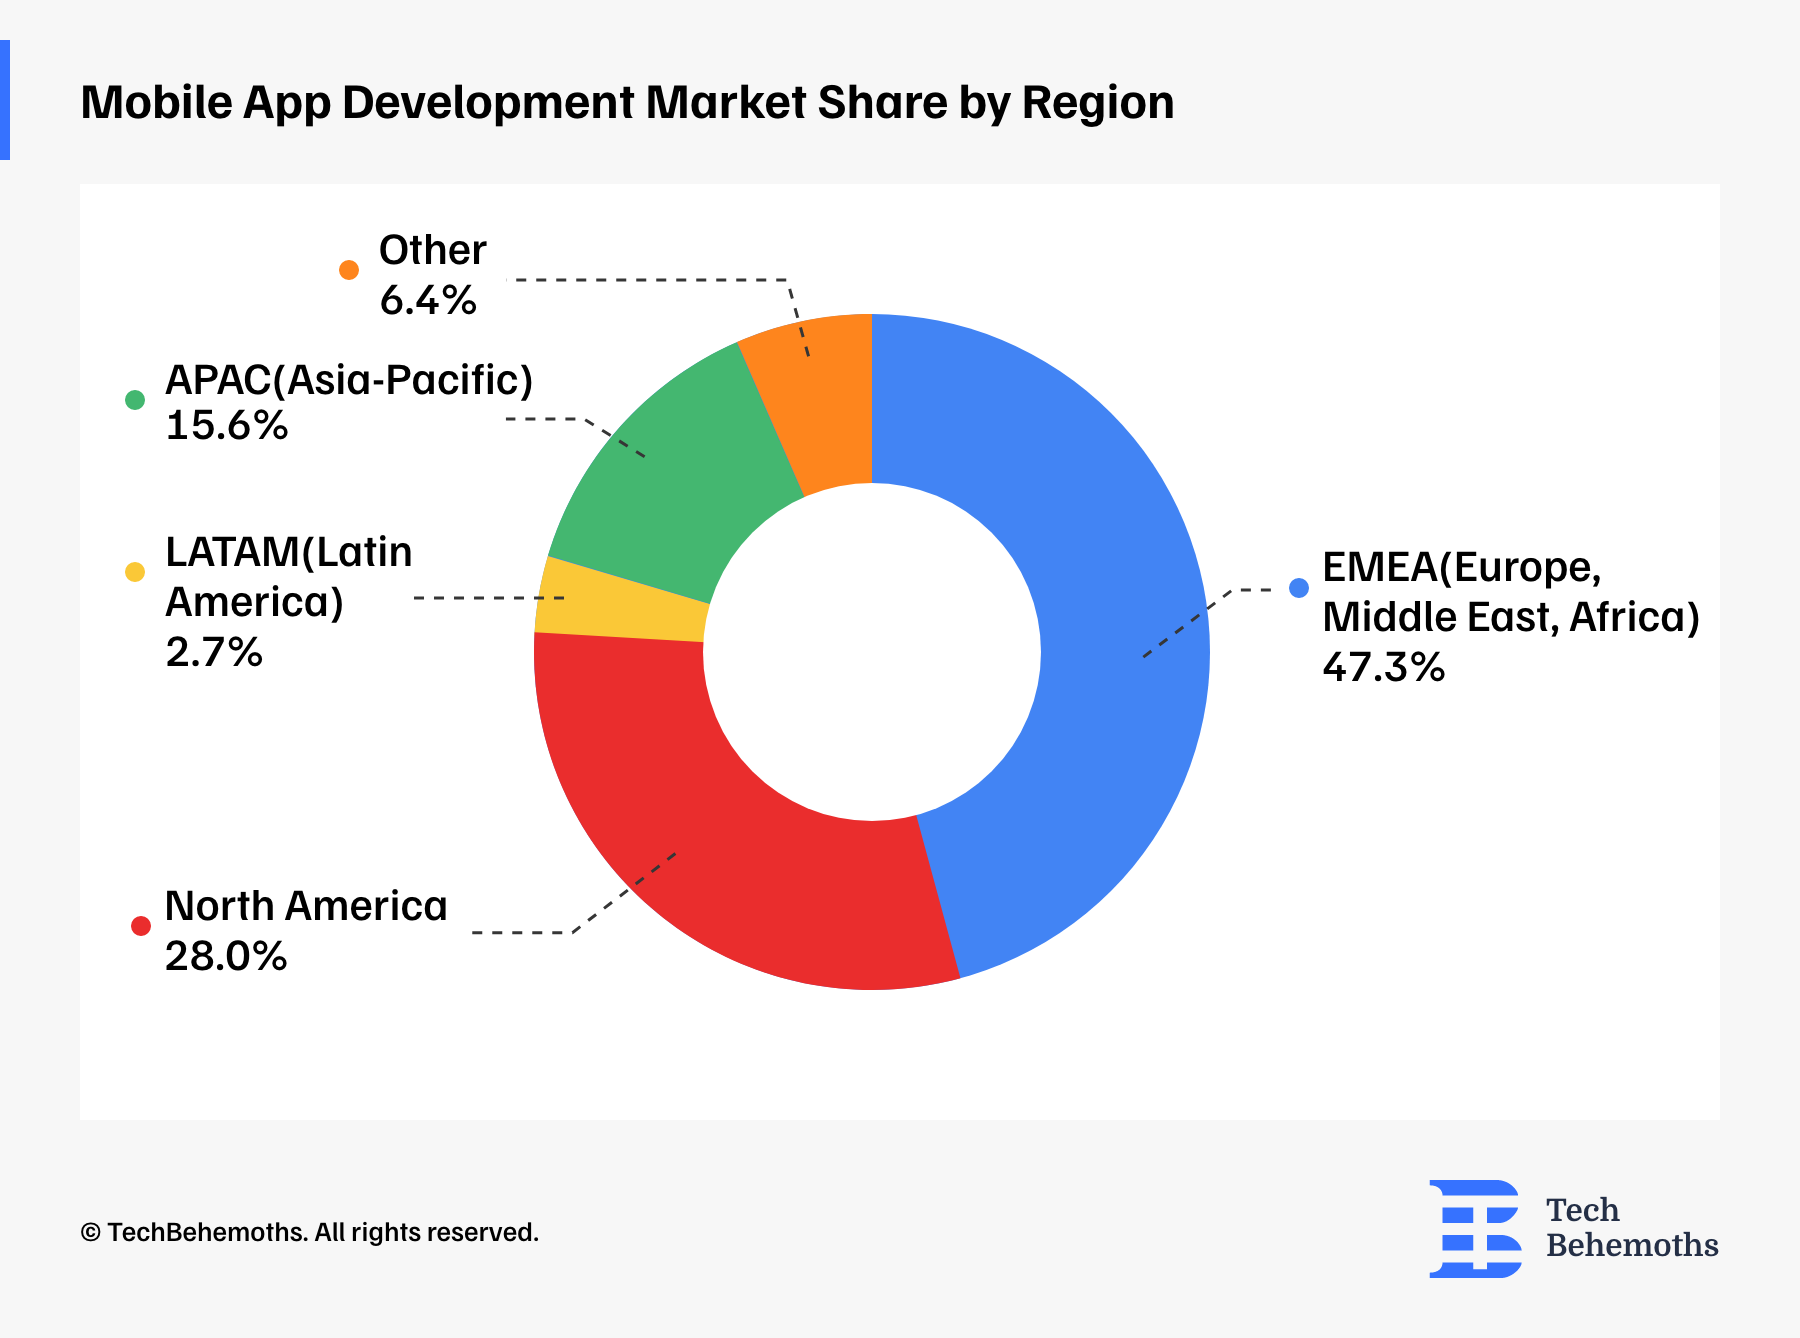
Mobile App Development Market Share by Region
When it comes to geographical distribution, mobile app developers declared that 47.3 % of apps have been provided to the EMEA region. North American businesses are also a large consumers of app development services, as 28% of companies declared that they developed apps for NA.
Next follows the APAC (Asia-Pacific), with 15.6% of the geographical share of mobile apps. The least popular region, for which companies developed mobile apps is the LATAM (Latin America) with a share of 2.7% in 2023-2024.
6.4% of companies declared a mix of these region, didn’t measured, were not knowledgeable about, or do not want to disclose this information, which in the results below were classified as other
Final Words
Considering the trends highlighted in this Mobile App Development report, we can notice a considerable cost growth for Mobile App development, and also the demand for complex applications. While the rates of developers do not play a significant role in determining the end budget for an app, it is still worth considering that qualified developers may charge higher.
In terms of tools and methodologies, there is nothing unsurprising as Agile and Slack have been popular in the tech industry for some time now, and the survey confirmed this fact one more time, now in 2024.
An interesting observation is that now, more companies choose to maintain mobile apps in-house rather than outsource this process somewhere else. This could be conditioned by new terms and conditions included in the contract, or by the need of mobile developers to increase and maintain a reputation on the market considering the level of competitiveness, globally.
We’re looking forward to see shifts in mobile app development cost and also in their types in the next few years, as social behavior and access to technology are the main elements of demand on the mobile app development market.
Partner Companies
The survey was not limited to any geographical region or country and its main target was the global community of IT companies and web agencies. As such, survey respondents totalize the number 1457 specialists from 959 companies, located in 54 countries across the globe. On this occasion, TechBehemoths is proudly announcing and crediting the list of partner companies that helped spread the word and gather answers for this survey.
-
VOLO, Armenia
-
DevelopWay, Armenia
-
SCD Company, Armenia
-
Moxman digital pvt ltd, Australia
-
Nascenia, Bangladesh
-
Retina Soft, Bangladesh
-
Amygdal, Bosnia and Herzegovina
-
Innostax Tech LLC, USA
-
Droxic, Bulgaria
-
Bulcode, Bulgaria
-
Wollow, Bulgaria
-
Vertical Motion, Canada
-
Acid Labs, Chile
-
launchOptions, Cyprus
-
Acropolium, Czechia
-
edenhall s.r.o., Czechia
-
buinsoft, Czechia
-
Ishir, USA
-
Jow Software, Tanzania
-
Popupagency, Qatar
-
Edge Studio, UK
-
EchoGlobal, Estonia
-
SDA, Estonia
-
KeyToTech, Estonia
-
Midas Solutions, Estonia
-
Digipal, Estonia
-
Loovatech, Estonia
-
Boldheart, Germany
-
Ryvilion, Germany
-
NFQ Technologies, Germany
-
LeverX, USA
-
candee, Greece
-
Fora Soft Limited, Hong Kong
-
Yaali Bizappln Solutions, India
-
Ui-Ux Design, India
-
Codewave, India
-
i.am.retailer, India
-
Green Apex Solutions Limited, India
-
Jash Entertainment, India
-
DMCS INDIA, India
-
Aspire Softserv Pvt. Ltd., India
-
Briskstar Technologies LLP, India
-
MobileCoderz Technologies, India
-
DTC Infotech, India
-
Sixty13 Web Solutions, India
-
Deqode, India
-
ruttl, India
-
Excelsior Technologies, India
-
EDIIIE, India
-
iRoid Solutions, India
-
Ladhani, India
-
GeekyAnts, India
-
WeeTechSolutions, India
-
Expertinasia Pvt. Ltd., India
-
Piexxi Technology LLP, India
-
Webelight Solutions, India
-
illuminz, India
-
Kashi TheCoders, India
-
Groovy Technoweb PVT. LTD., India
-
axiusSoftware, India
-
iSummation Technologies, India
-
Safnah IT Services, Iraq
-
ZUZEX, USA
-
Epigra, Turkye
-
Lasting Dynamics, Italy
-
Snotor, Latvia
-
Primal Ape Consulting, Lebanon
-
SoftTeco, Lithuania
-
Mygom.tech, Lithuania
-
Digital Dose, UK
-
Snappymob, Malaysia
-
Imagint Sdn Bhd, Malaysia
-
Ancient, Mexico
-
E-Signature Pvt. Ltd., Nepal
-
Corvo Inc., Nepal
-
Janaki Soft, Nepal
-
Future Forward, Netherlands
-
Lizard Global, Netherlands
-
iNFOTYKE, India
-
Voyage, New Zeeland
-
Neobot Tech, Nigeria
-
DotCircle Labs, Nigeria
-
ZeroTen Technologies, Nigeria
-
Avcera Technology, Nigeria
-
Siwtech Solutions, Pakistan
-
INFINITY-UP, Pakistan
-
Elite Designs Official, Pakistan
-
TechnoLyte, Pakistan
-
Technology Bench, Pakistan
-
Technology Bench, Pakistan
-
Prob N Tech, Pakistan
-
Omnisoftex Inc., Pakistan
-
MONGID | Software House, Palestine
-
Inab Technologies, Palestine
-
Inovatis Group SA, Paraguay
-
Codefia, Poland
-
Cherryvue, Poland
-
WeAstronauts Software, Poland
-
InterSynergy, Poland
-
Qarbon IT, Poland
-
MuchMore Software House, Poland
-
Sailing Byte, Poland
-
HUSPI, Poland
-
Polcode, Poland
-
Infeon Tech Private Limited, India
-
Vibes Web Design, Qatar
-
Neo Vision, Romania
-
Wolfpack Digital, Romania
-
Fabrit Global, Romania
-
Tessafold, USA
-
Creative Solutions Co. Ltd, Saudi Arabia
-
Nistruct doo, Serbia
-
Deluminal, Serbia
-
Ingsoftware, Serbia
-
OmniShop, Serbia
-
8clicks pte ltd, Singapore
-
Vinova, Singapore
-
eFusion Technology Pte Ltd, Singapore
-
GrownApps s.r.o., Slovakia
-
Exceed IT, South Africa
-
NESLO, South Africa
-
ElmMac, South Africa
-
Alameda Dev, Spain
-
Software and web development, Sri Lanka
-
WEB CORPORATION, Tanzania
-
Techstaunch, India
-
Cool Digital Solutions, Turkye
-
CoduGuru.ae, UAE
-
800website.ae, UAE
-
Computer Store Uganda Limited, Uganda
-
Postjer Group, UK
-
Kernelics, UK
-
MaboaSoft, UK
-
RetroStyle Games, Ukraine
-
stfalcon, Ukraine
-
NERDZ LAB, Ukraine
-
CloudFlex, Ukraine
-
Onix-Systems, Ukraine
-
Kozak Agency, Ukraine
-
Linkup Studio, Ukraine
-
ImproveIT Solutions Ltd, Ukraine
-
Incode Group, Ukraine
-
WebSailors, UAE
-
Magora, UK
-
TeamStation AI the United States of America
-
Altoros, the United States of America
-
Grio, USA
-
HyperSense Software, USA
-
Azumo, USA
-
DigiTrends, USA
-
The Gnar Company, USA
-
SEO Guru Atlanta, USA
-
CCS Interactive, USA
-
Mobisoft Infotech, USA
-
Codifee, USA
-
Fifth LLC, USA
-
Prospus, USA
-
SolveMind/OTAKOYI, USA
-
Create Ape, USA
-
CCS Interactive, USA
-
Ortus Knights, USA
-
Rootstack, USA
-
Bac Ha Software Co., Ltd, Vietnam
-
Dirox, Vietnam
-
AMCOLAB, Vietnam
-
Mobirevo, Nigeria
-
Velvetech, USA
-
Umbrella IT, USA
-
Fusion Tech, USA
-
AIML Services, Canada
Researching, analyzing, and writing insightful stuff is what I do for a long time now at Mobiteam. At TechBehemoths, I put all my experience and knowledge work for IT companies and businesses and help them reach each other.
Discover more TechBehemoths Insights
Learn practical tips and insights about IT Companies, how to find the right company for your projects.
Read the latest news about Market Trends and fresh Interviews.