How Ads Impact Consumers: 2021 Survey

Ads are one of the most powerful and convincing tools used to attract and convert us, consumers, into clients. But over time as their popularity has grown among businesses, ads become uncontrollable by consumers, which made them one of the most undesired items by users. Today, ads have a strong social and psychological control over users, that also have a thing or two to say about them.
That’s why TechBehemoths conducted a survey on a total pool of 3218 people across 15 countries worldwide. The survey called “How ads impact your behavior” collected answers between Nov 15 - 29, 2021, and aimed to identify consumer views over ads, and how they feel ads impact over themselves.
Out of all respondents, almost ⅓ come from United States - 994 respondents and the least come from Kenya - 12 respondents. The geographical distribution of respondents per continent is as follows:
-
North America - 1106 participants
-
South America - 103 participants
-
Europe - 1298 participants
-
Africa - 12 participants
-
Asia - 699 participants
How Ads Impact Consumers - Age Group Distribution
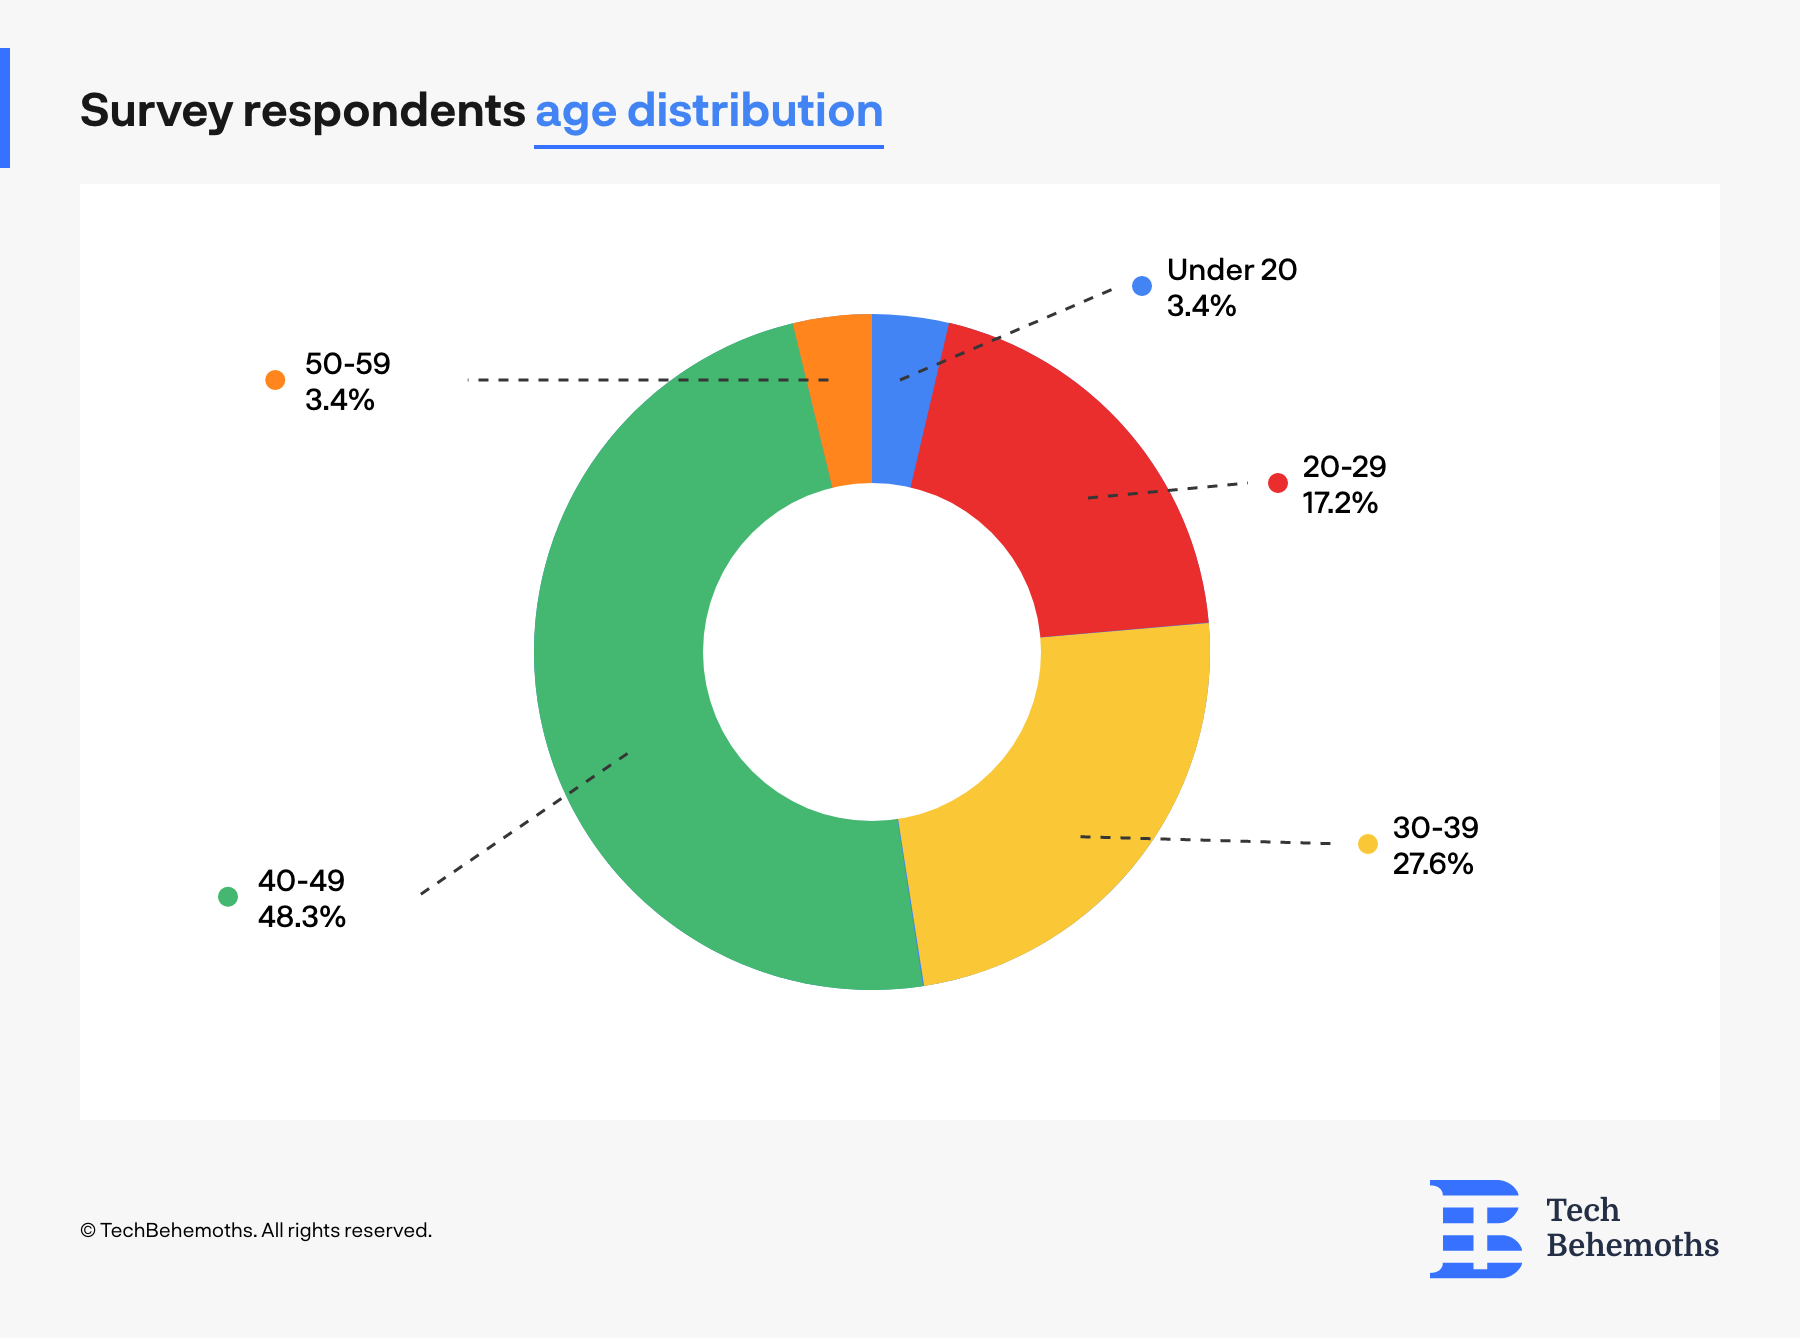
Although the survey was public and opened to all group ages, the result show that Baby Busters and Millenials have a higher response rate compared to Generation Z. A logical explanation of this phenomenon is that older generations are more experienced and share between them concerns about internet and ads impact, while not so many Generation Z managed to learn about digital entrepreneurship, and ads as something impactful. Probably the wide majority of youngsters couldn’t imagine the internet without ads, or the world without internet. These all taken together are decisive factors that make younger generations to lack interest in such subjects.
Out of all 3218 respondents, almost ½ or 48.3% are 40-49 years old. Also, 888 respondents or 27.6% have between 30-39 years. This means that more than ⅔ of all respondents are above 30 years old. A total of 20.5% are below 30 years old, and also 3.4% of respondents are above 50.
During this survey, TechBehemoths teamed up with other 25 IT companies which also participated in this survey.
Ads Distribution by Source
Ads are proportionally visible depending on how we, consumers, spend our time. And with the emergence of social media, the broad majority of people are sharing a consistent amount of their free time on these platforms. Respectively, when asked where consumers think they are exposed to ads more, 75.9% or 2445 of respondents answered on social networks. The second most popular answer is also a digital source - 13.8% of all respondents think that they see most of the ads on websites. Newspapers, TV and streed ads have a total share just a little above 11%.
The answers given by respondents confirm that classical advertising sources are far behind the digital ones, and what is more interesting - people don’t pay as much attention to street or TV advertisements compared to the volume of ads on these sources.
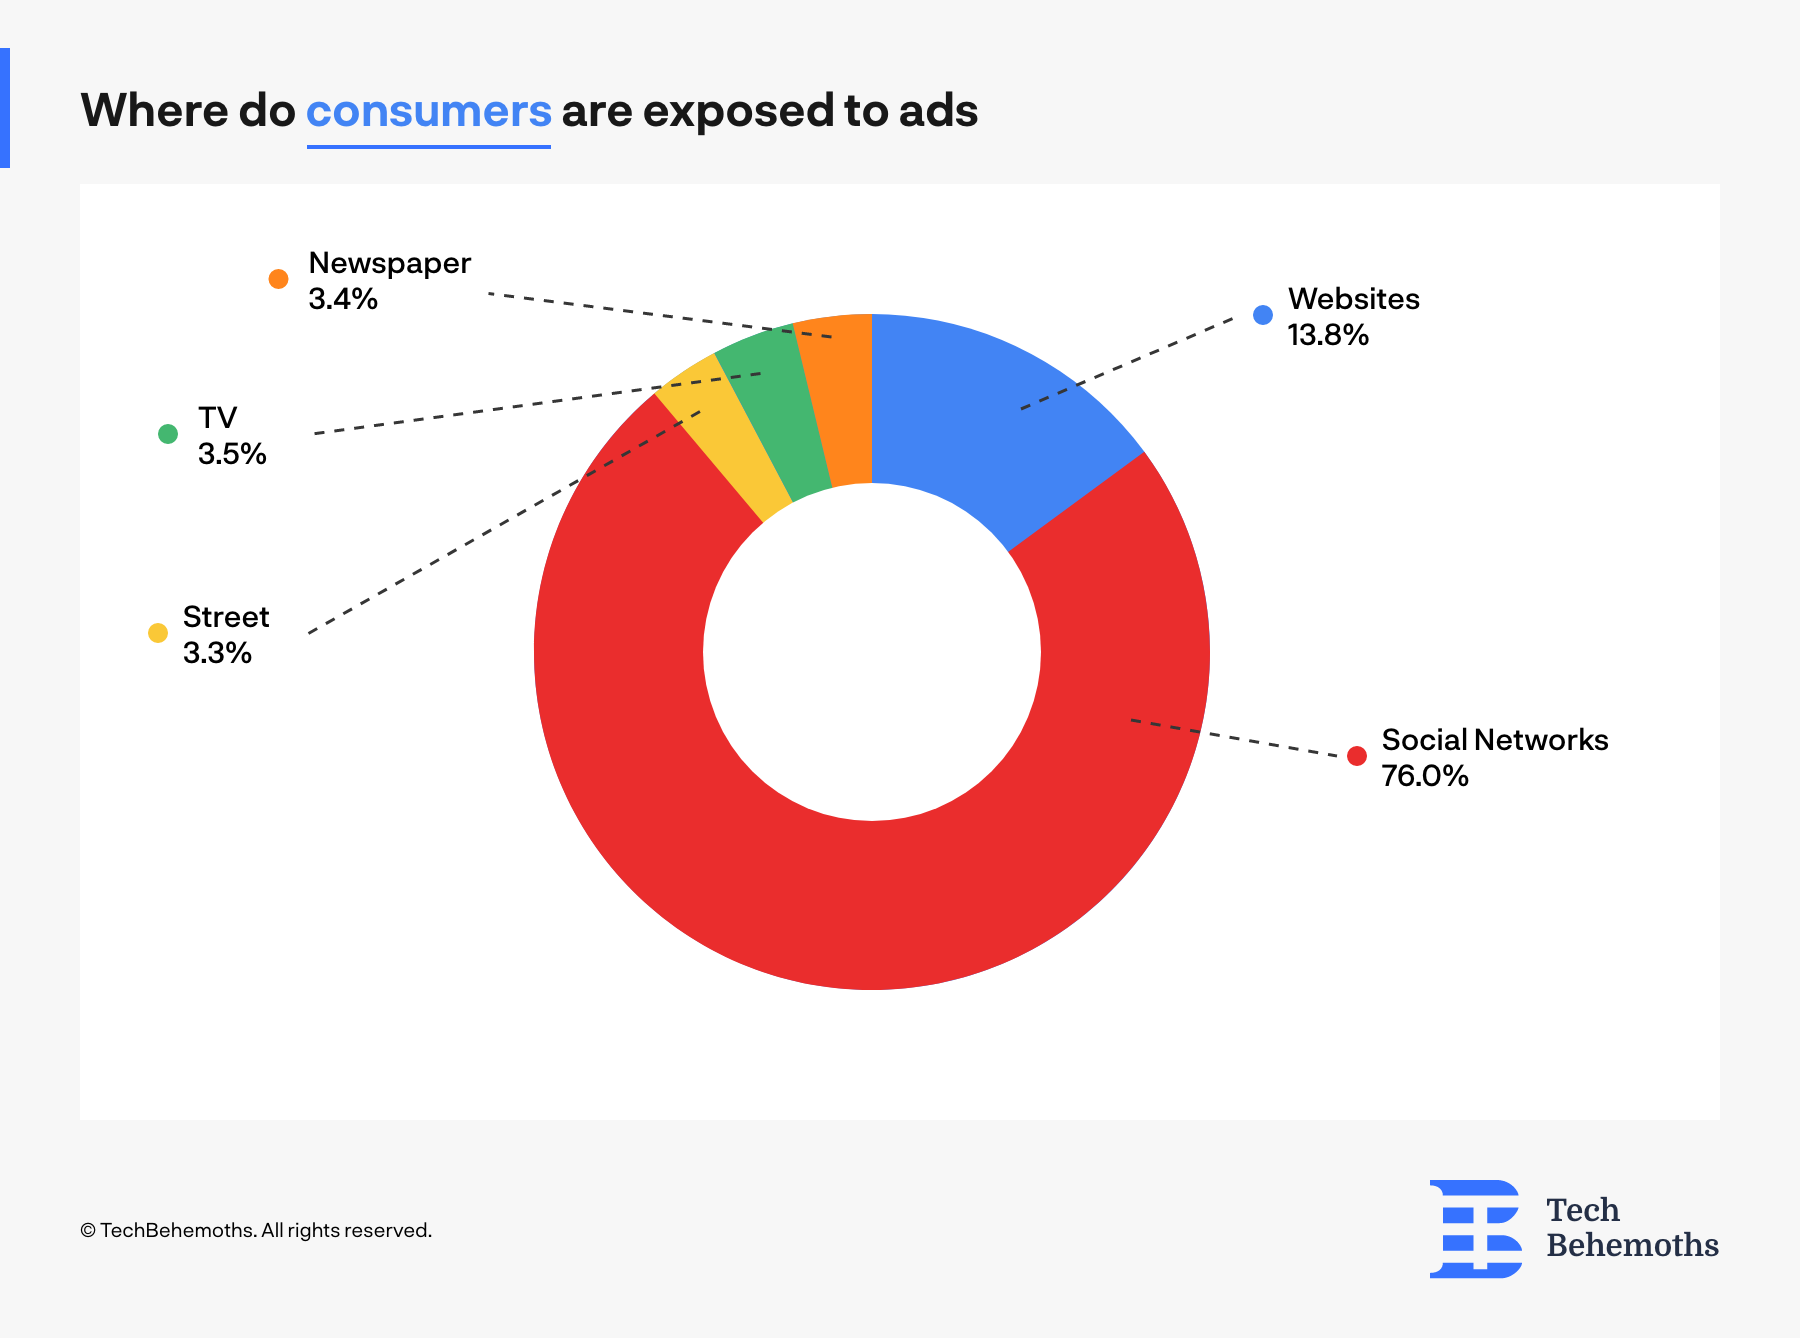
It was rather predictable that social networks display most of the ads, and is no surprise that a big number of websites also accept ad publishing for various reasons, such as covering spendings, delivering more traffic, and content enrichment to name a few. However, the number of ads people think are exposed to is significantly lower than the number of ads displayed on various sources.
How Many Ads Do You Think You See In 1 Day?
During the survey, participants were asked about the number of ads they think they see in 24 hours. 34.6% of respondents think they see between 10-20 ads per day and 20.7% of survey participants assume that the number of ads they are exposed to in the same timeframe is between 20 and 30.
At the same time, 774 people out of 3218 respondents, or 24.1% see more than 30 ads per day, and only 3.4% of all participants think they see less than 5 ads during 1 day. As there are no statistics to the number of display ads on social networks, TV, streets, and other sources, and also the number of seen ads per day depends on things like location, job, preferences, and habits, a study released by PCProtect mentioned that people are exposed to 6000-10,000 ads per day.
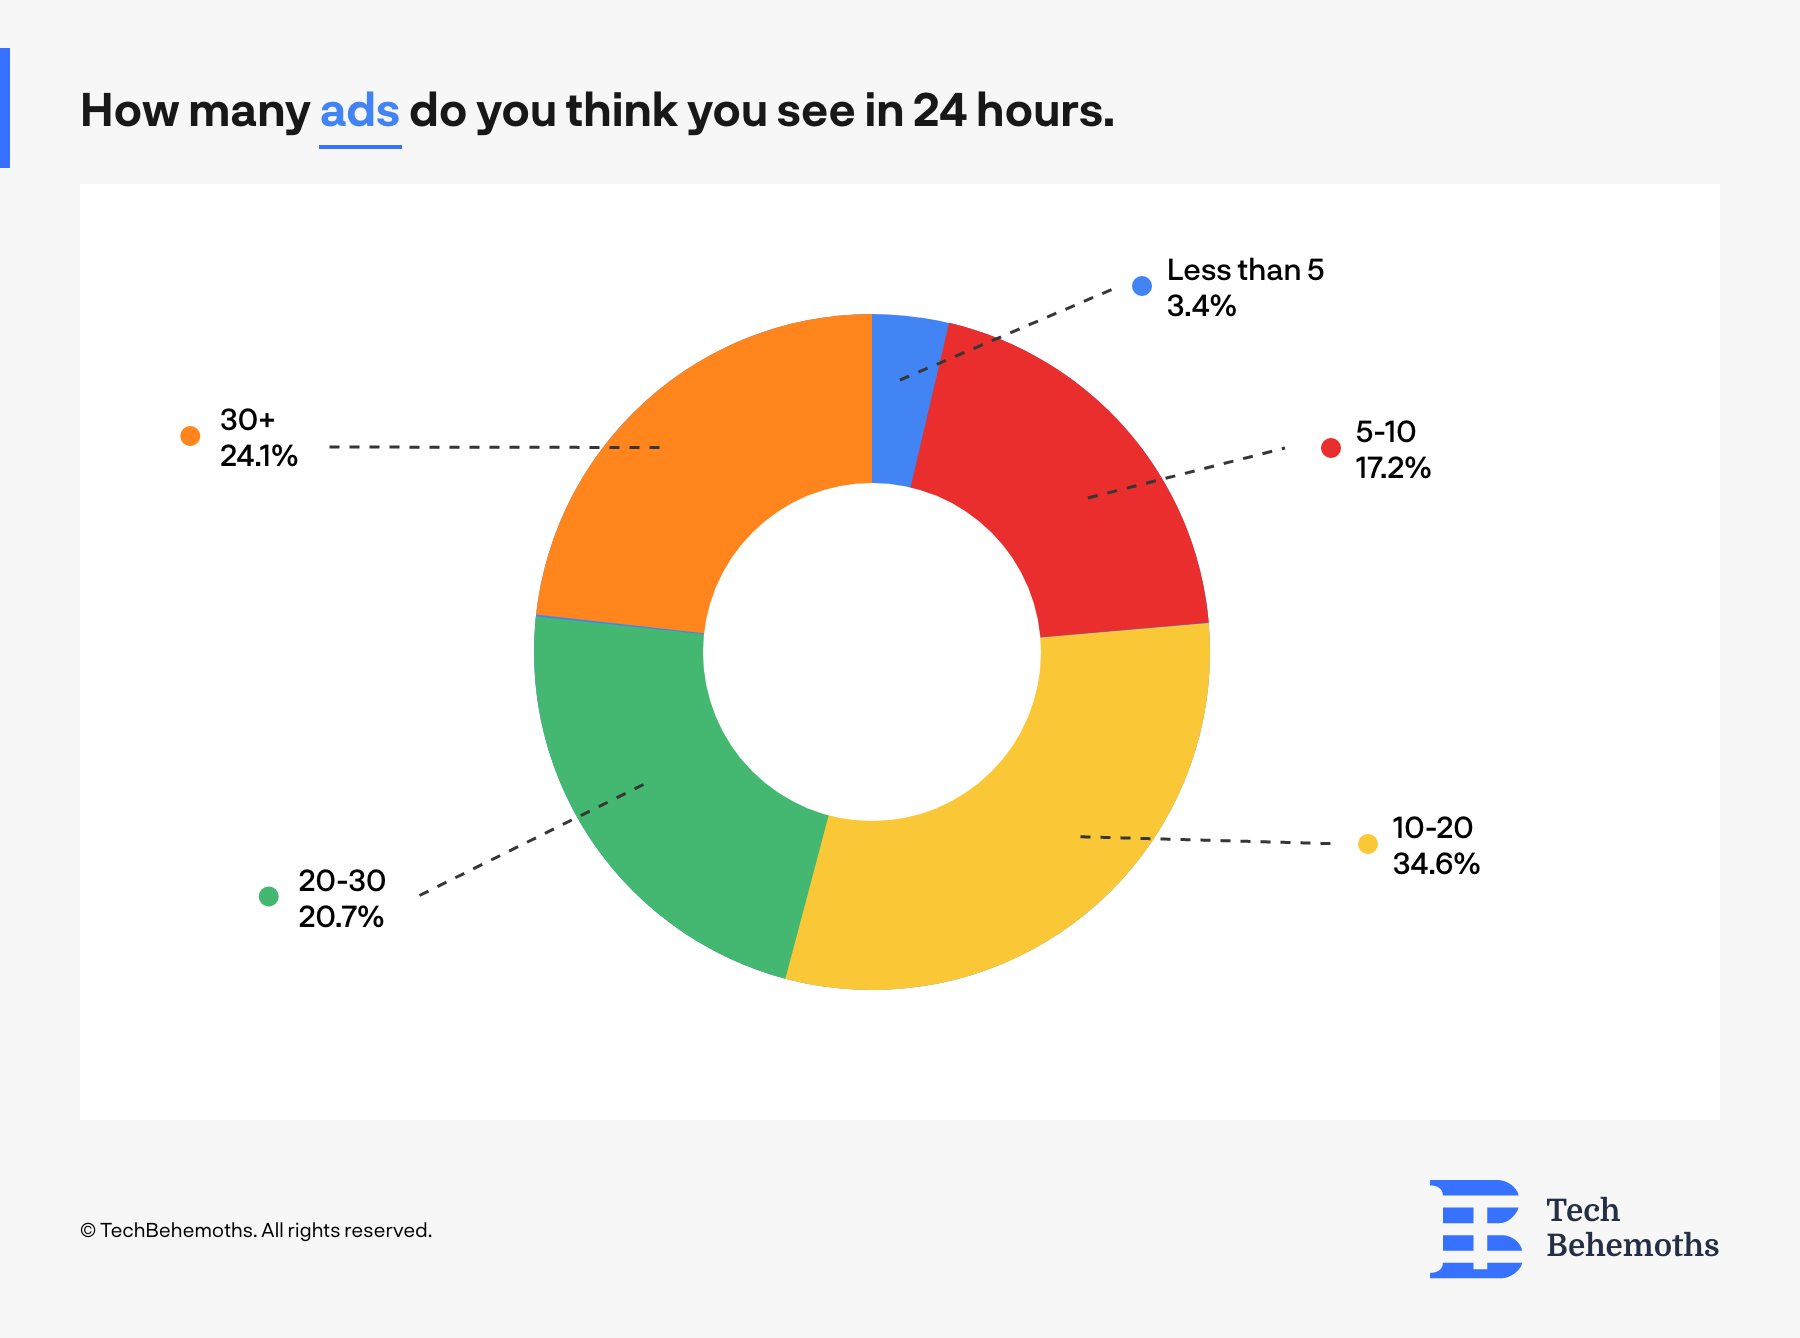
That’s why during the survey we delivered the question regarding this topic to identify how many ads people remember they see, rather than to learn the number of ads people are exposed to. And the survey shows that ⅔ of respondents retain up to 30 ads, and less than ¼ memorize more than 30 ads per day.
How People Respond to Ads
Basically, there are three options when we see an ad:
-
To take it into consideration - this includes sharing, appreciating it, or thinking about the advertised product as a possible acquisition.
-
To ignore it - leave it the way it is and move/scroll further
-
And to block it - from preventing it via various tools up to reporting the ad.
Most of the ads are ignored and this has been happening even earlier than 2014 - a Media Post study shows. Ignoring ads is the worst thing that advertisers can get from their campaigns as they can’t collect any valuable information. The next bad thing can happen to an advertiser is to address an audience that uses ad-prevention tools, or those who are reporting their ads.
When asked if they reported an ad recently, 55.2% of all survey participants, or 1776 people answered “No”, while other 1219 people (37.9%) answered with “Yes”.
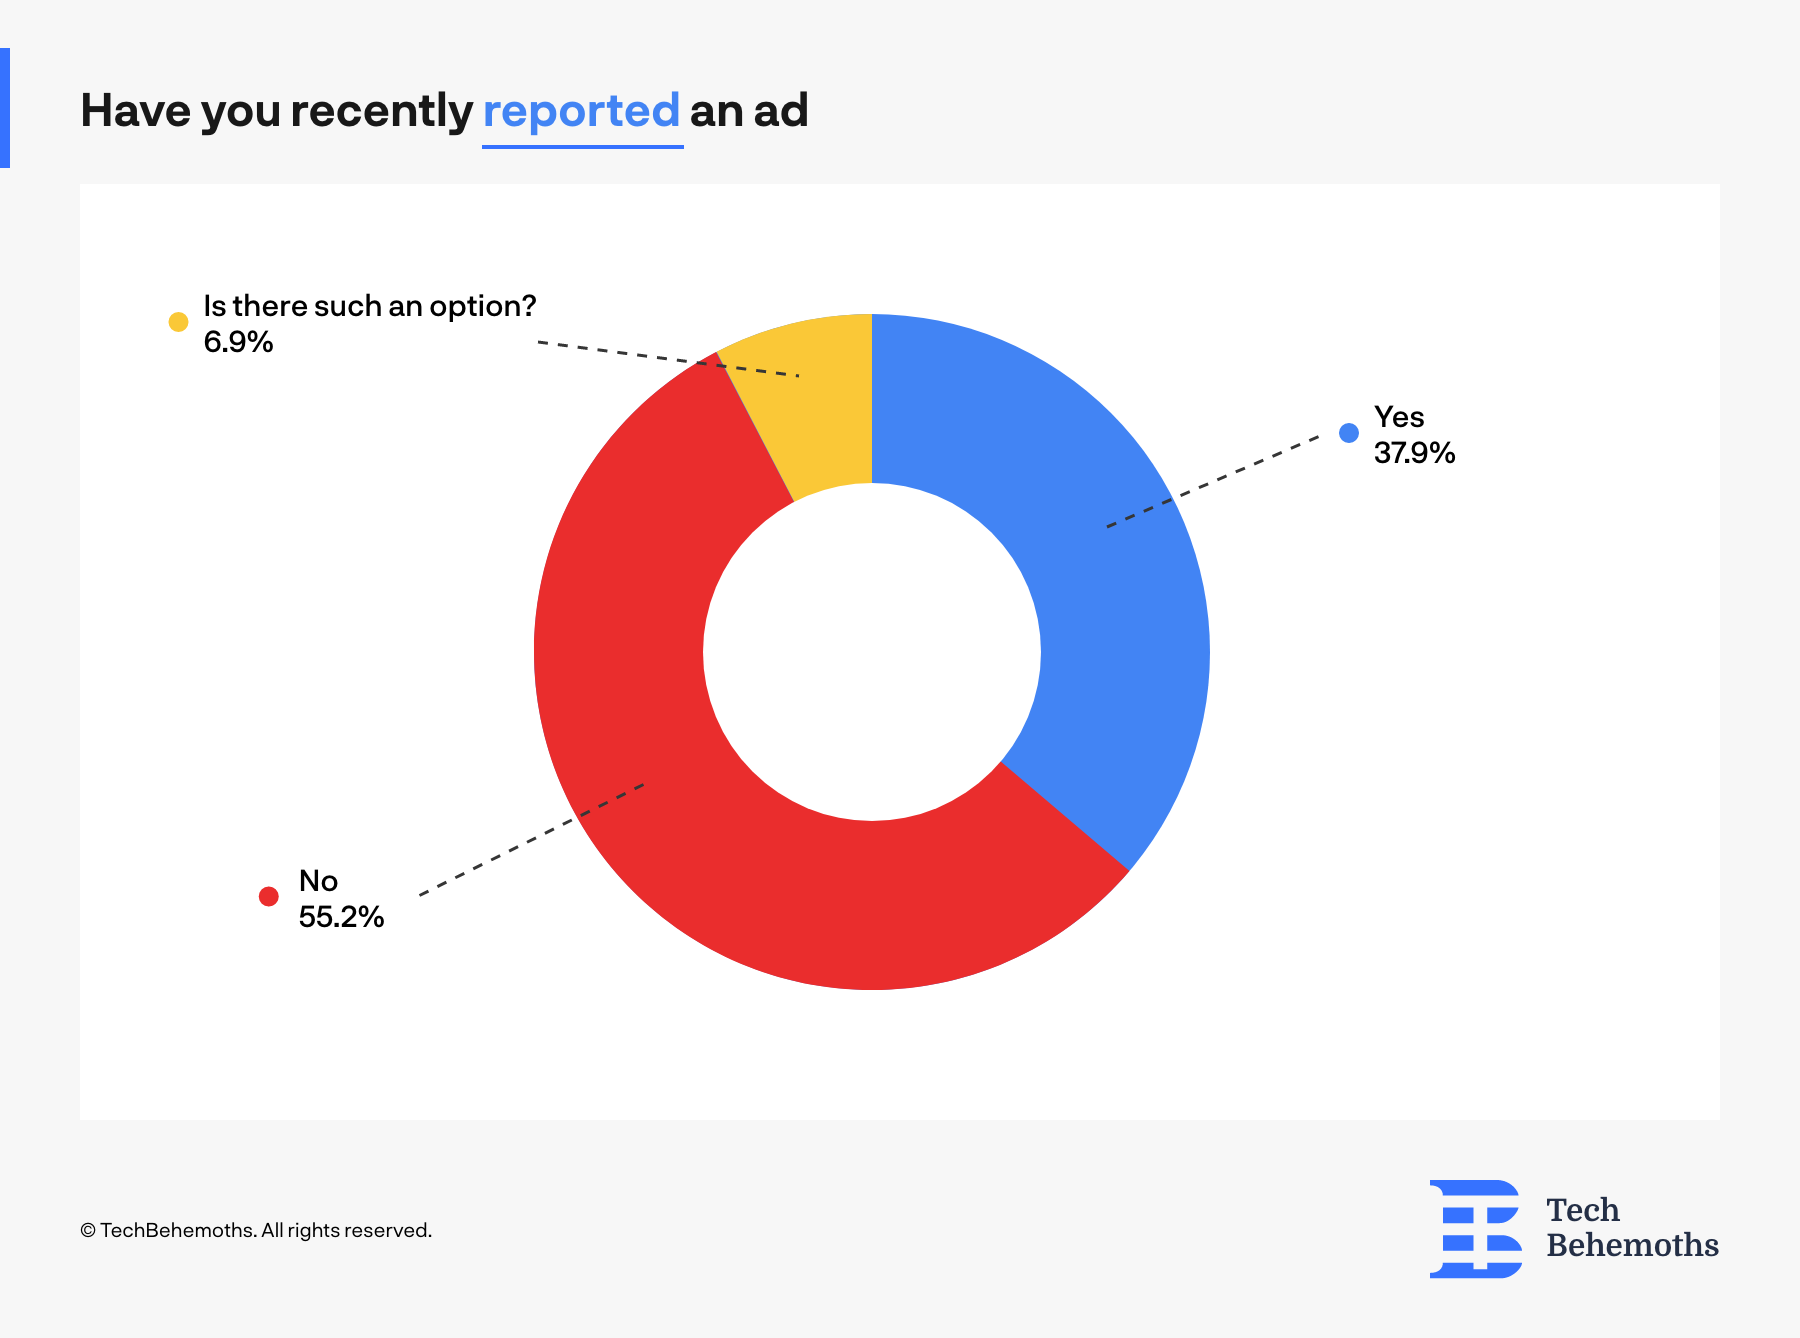
Other 6.9% of all respondents didn’t even know about such an option, which is surprisingly beneficial to advertisers, social networks, and websites that host ads.
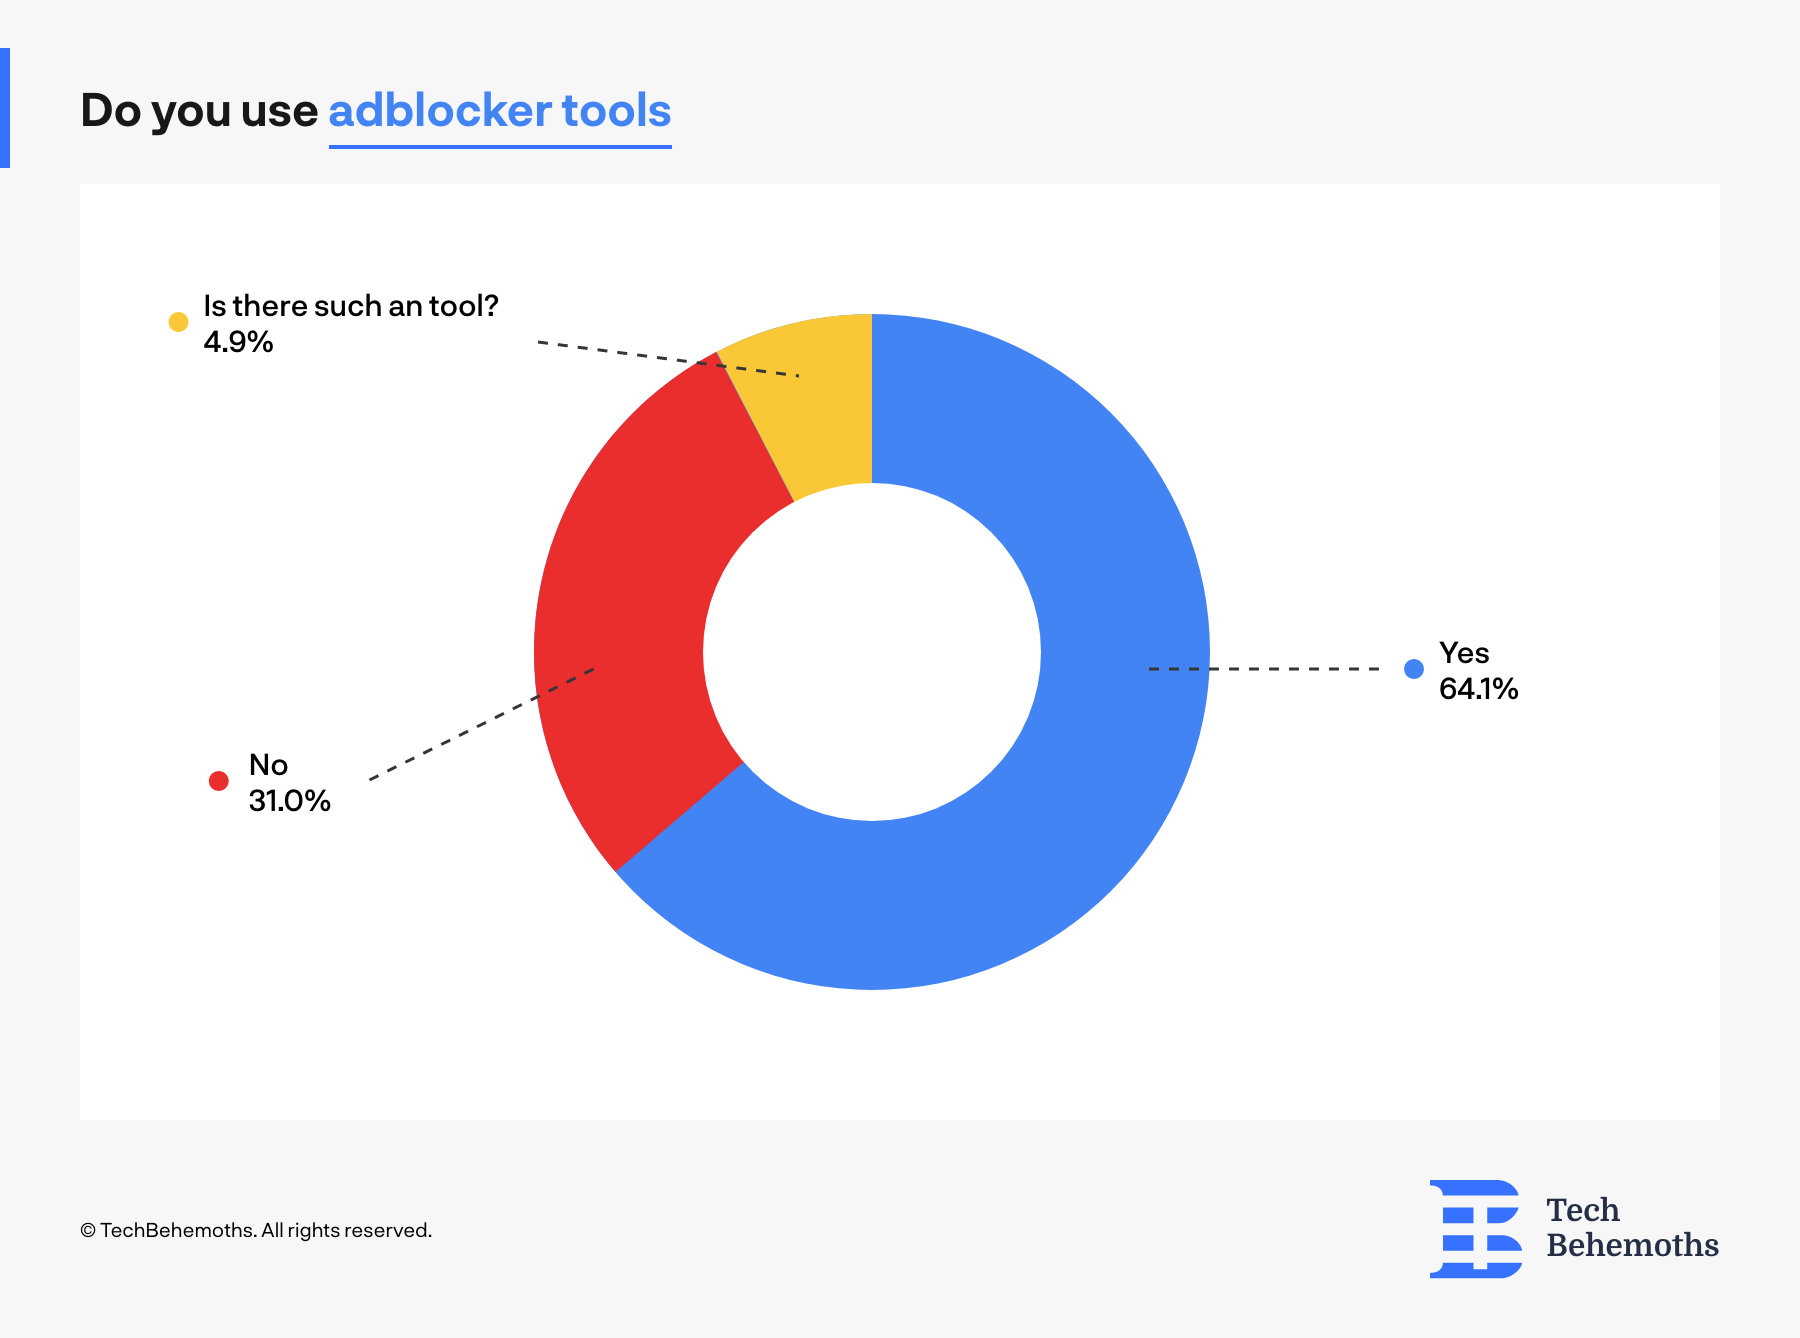
Another topic about ad prevention and blocking is ad blockers. This time the statistics are against advertisers, with 64.1% of respondents using adblocker extensions or tools. Recently, Google shut down one of the most popular extensions that fight ads - the Great Suspender. It was suspected that the extension tracked user data, and contained malicious code that harms user privacy.
On the other hand, there are hundreds of different ad blockers that can prevent ads from showing, but still, 31% of users don’t use adblocker extensions and tools, and even 4.9% don’t know about them.
Can Ads Help Consumers With Their Acquisition?
Ads can also be helpful, and in some cases play a decisive role in the decision-making process of acquiring a product or service. According to the survey results, 17.2% of all respondents think that ads can really help them to decide if a product is right for them or not, while other 31.1% think that ads have a small impact on their decision regarding a product or service.
However, the majority of respondents were indecisive if ads are helpful or not - 45% of participants answered “Not Sure” to the question: how much can ads help you choose a product or brand?
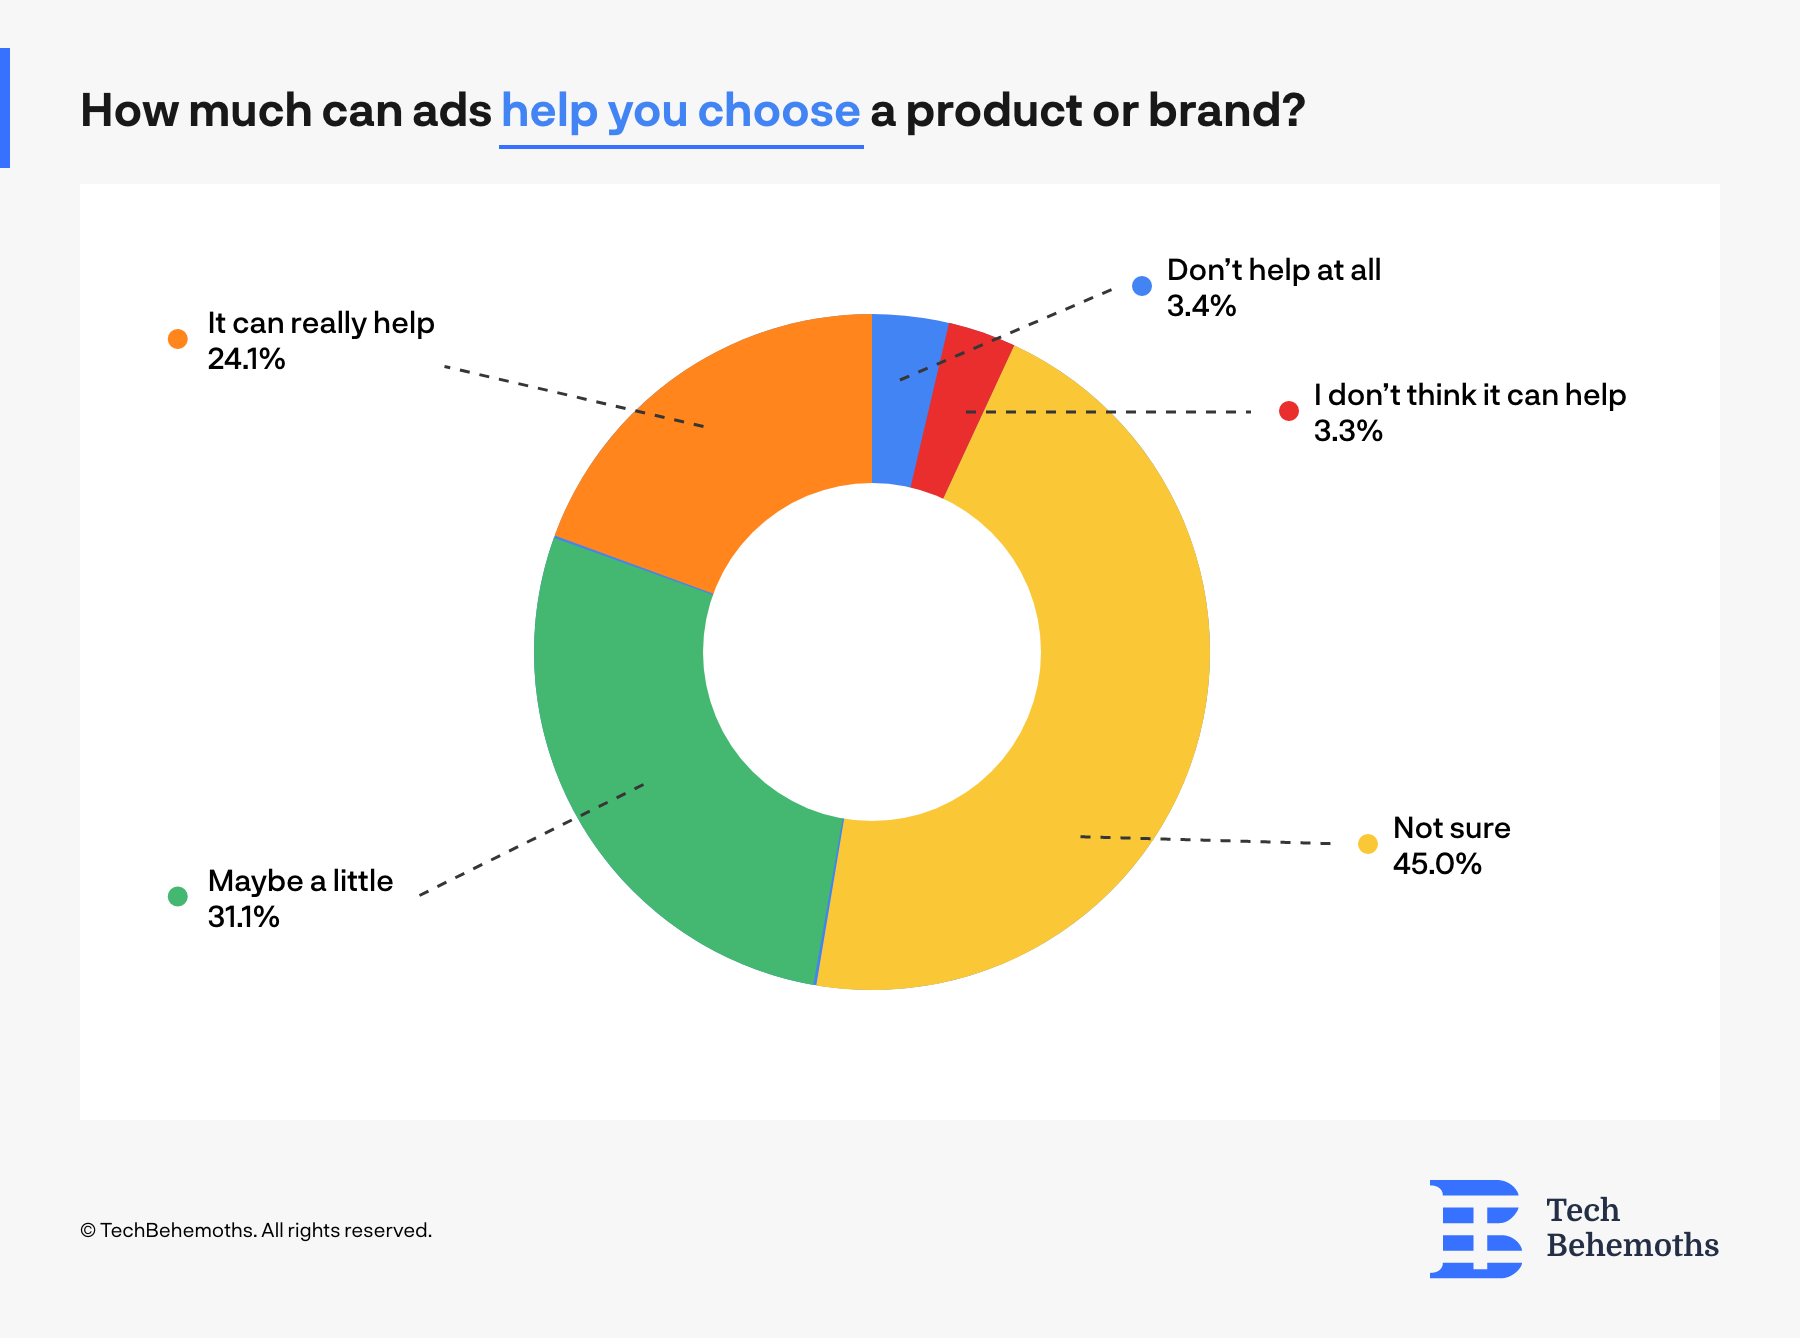
An important finding of this survey is that only 6.7% of respondents don’t think ads can help them in their choice of brand or product. So the main conclusion of this point is that people look for a hint in ads, or take ads as a key-factor that determines acquisition quality. This means that the better the ad is, the more likely people will buy the advertised product.
Ads Credibility Sources
People also tend to believe ads that appear on websites, and social media - the two major sources of ads. On the other hand there are also two emerging places where people give more credits when it comes to ads - referral ads and influencers.
According to the 2021 survey performed by TechBehemoths, ads displayed on websites, on social networks and those coming from friends or family have the highest credibility rate among respondents. When asked what are three ad sources that deliver the highest credibility rate? Survey participants answered as follows:
-
Websites - 69%
-
Social Networks - 65.5%
-
Friends referrals - 52.7%
-
Influencers - 24.1%
-
TV - 20.7%
-
Print - 6.9%
-
Radio - 5.9%
-
Street - 3.4%
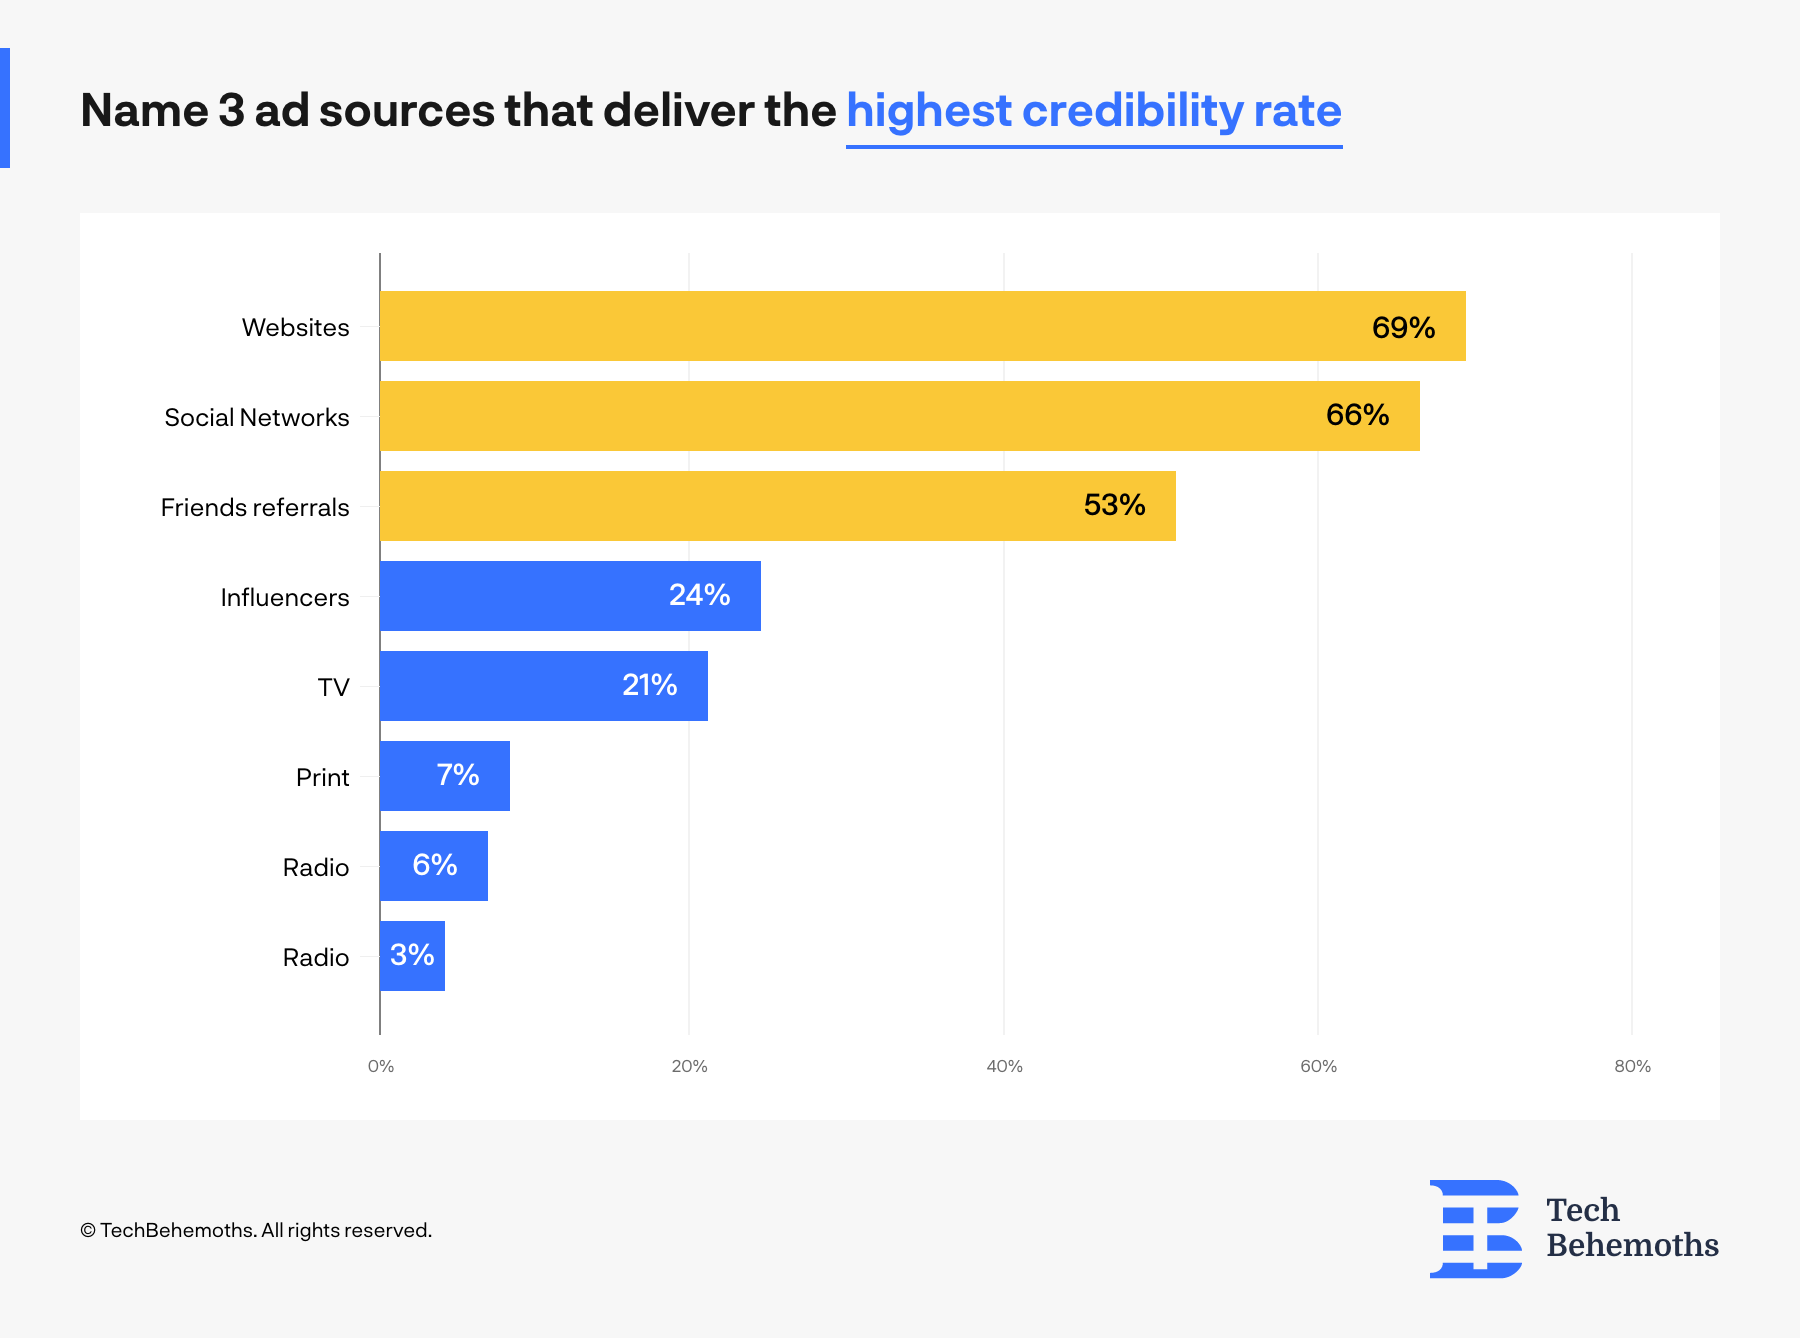
The key findings based on answers to this question show that people trust ads more on less visible sources (on websites), and separate influencers from social media even though most of influencer advertising is performed on Instagram, Facebook, TikTok and other similar platforms.
Exposure to ads on social media platforms
Since 76% of respondents consider that social media exposes them to most of the ads they see, it was crucial to research which platforms display the highest number of ads to users. According to the survey results, it seems that Facebook, YouTube, and Instagram are leading in advertising display to their users among all other social networks.
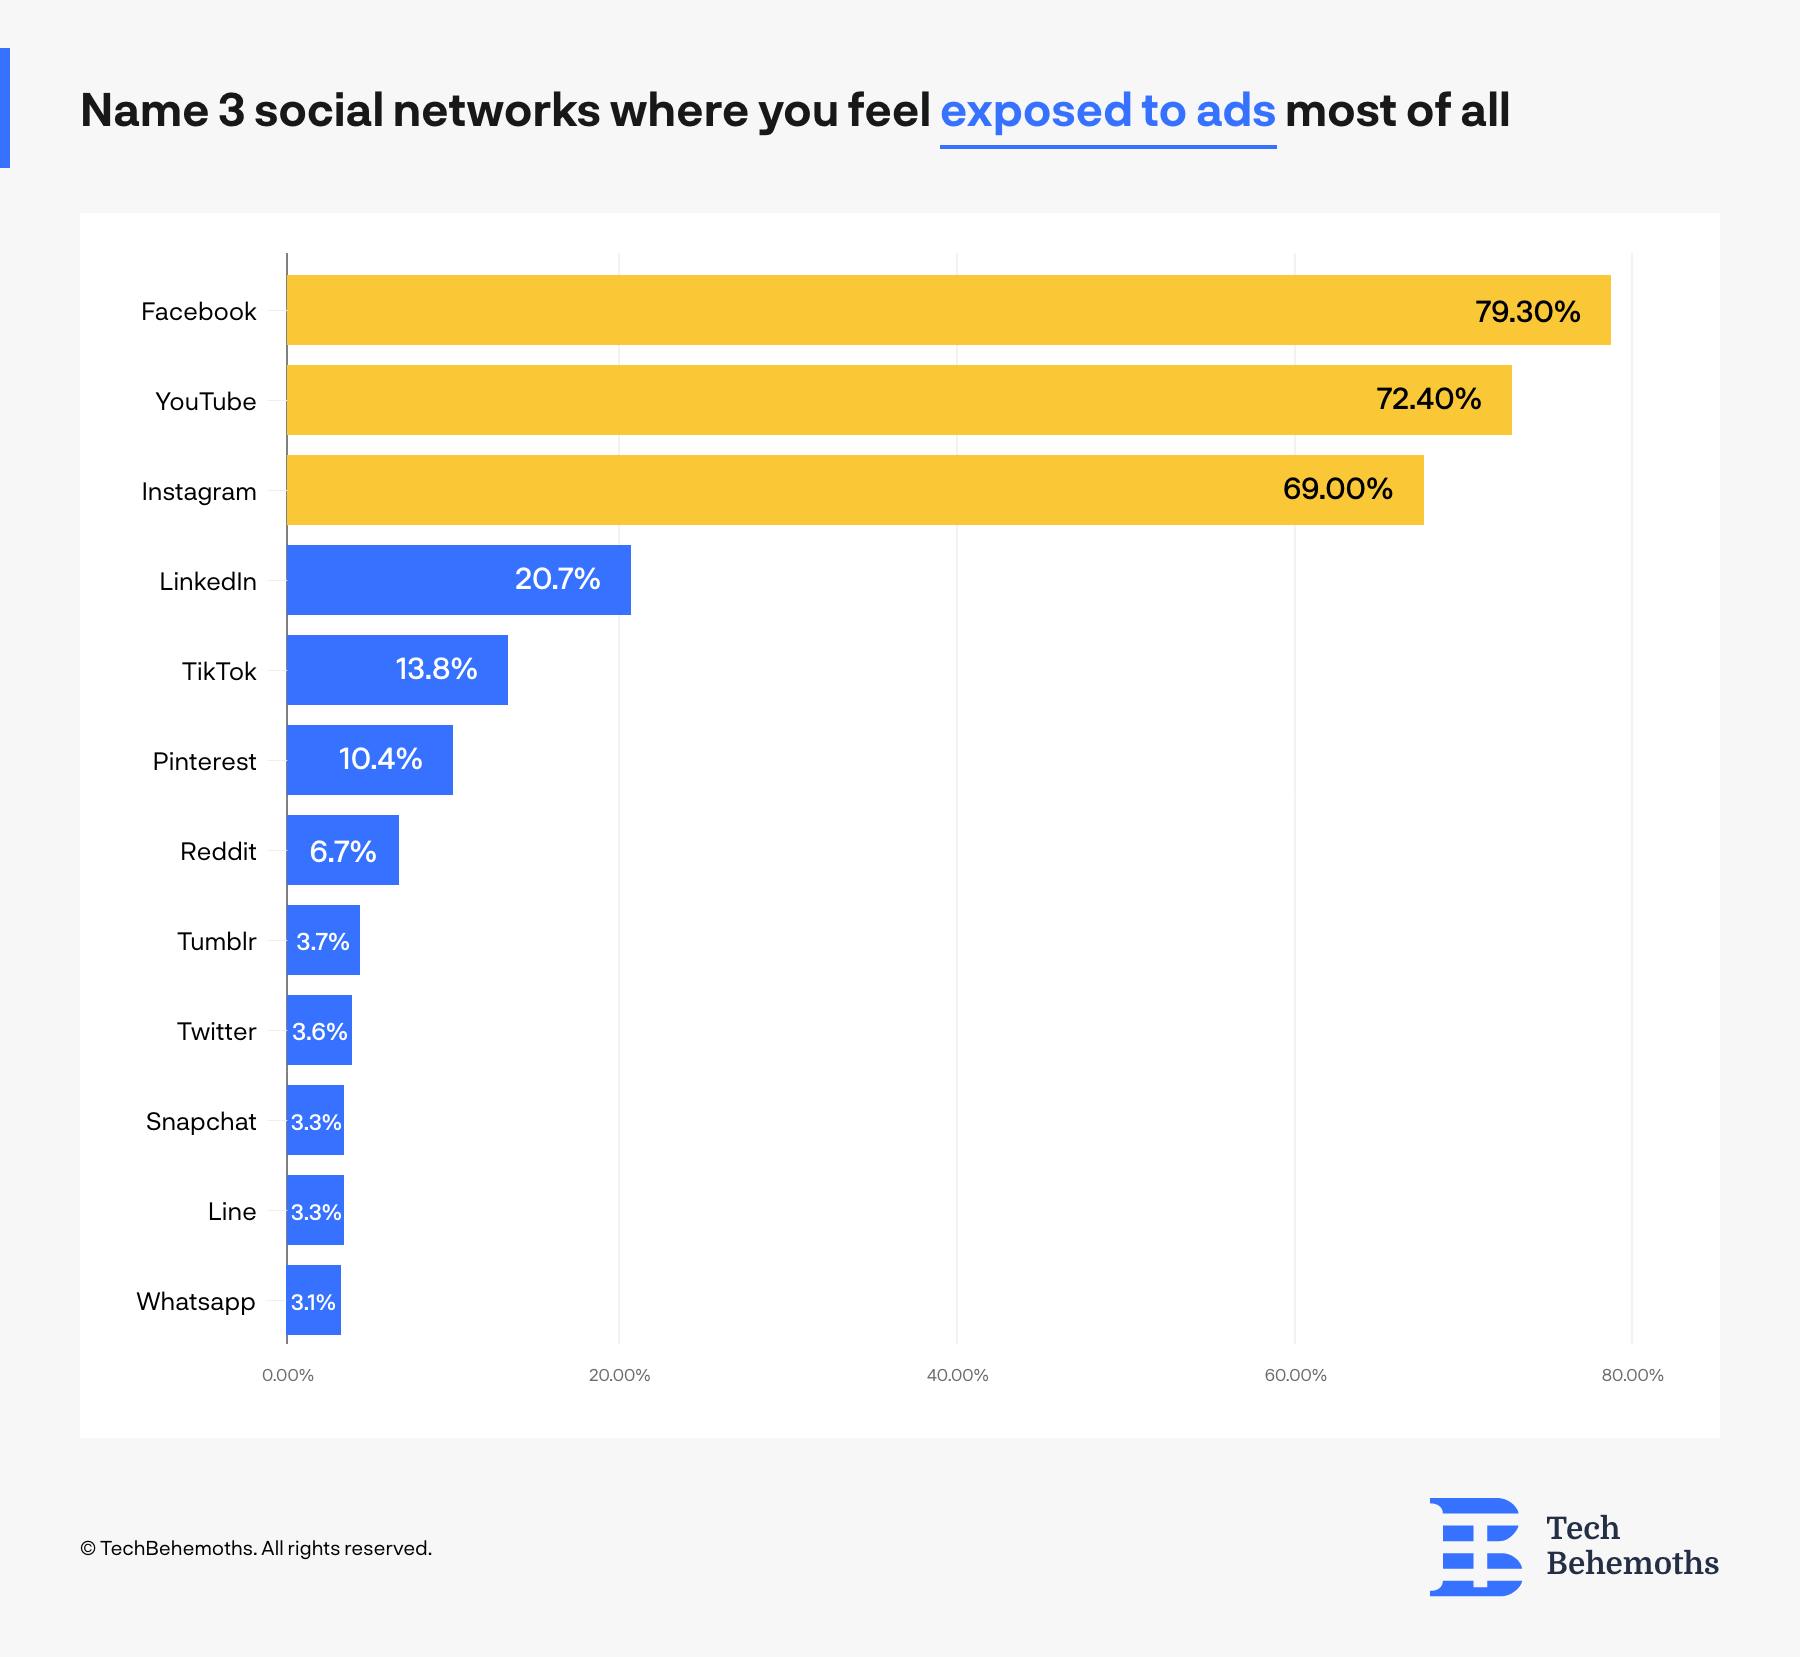
At the other end of the spectrum we have WhatsApp, Snapchat and Twitter where most of the users feel comfortable with the number of displayed ads. It is important to note that the differences between the first three and last three social networks are big enough to conclude that Meta, previously called Facebook, is using two of its largest social networks to increase their sales volume. The same example is taken by Google’s YouTube with the new ad policy. Now the platform is officially allowed to insert ads in all existing content, with or without author’s permission.
Influencer advertisement impact over consumers
The “How Ads Impact Consumers” survey shows that 24% of respondents think influencers should be trusted when it comes to ads. After all, their reputation is at stake if the advertised product does not meet audience expectations. But at the same time, influencers rarely have the choice to select between several products in the same niche to advertise. So, in the end, are influencers a credible source of ads or not?
According to survey responses, only 6.7% of participants buy a product after their favourite influencer(s) advertise a product. Other 20.9% or 672 respondents use to buy a product advertised by an influencer, and 24.1% don’t have a positive nor negative opinion about a product shared by influencers.
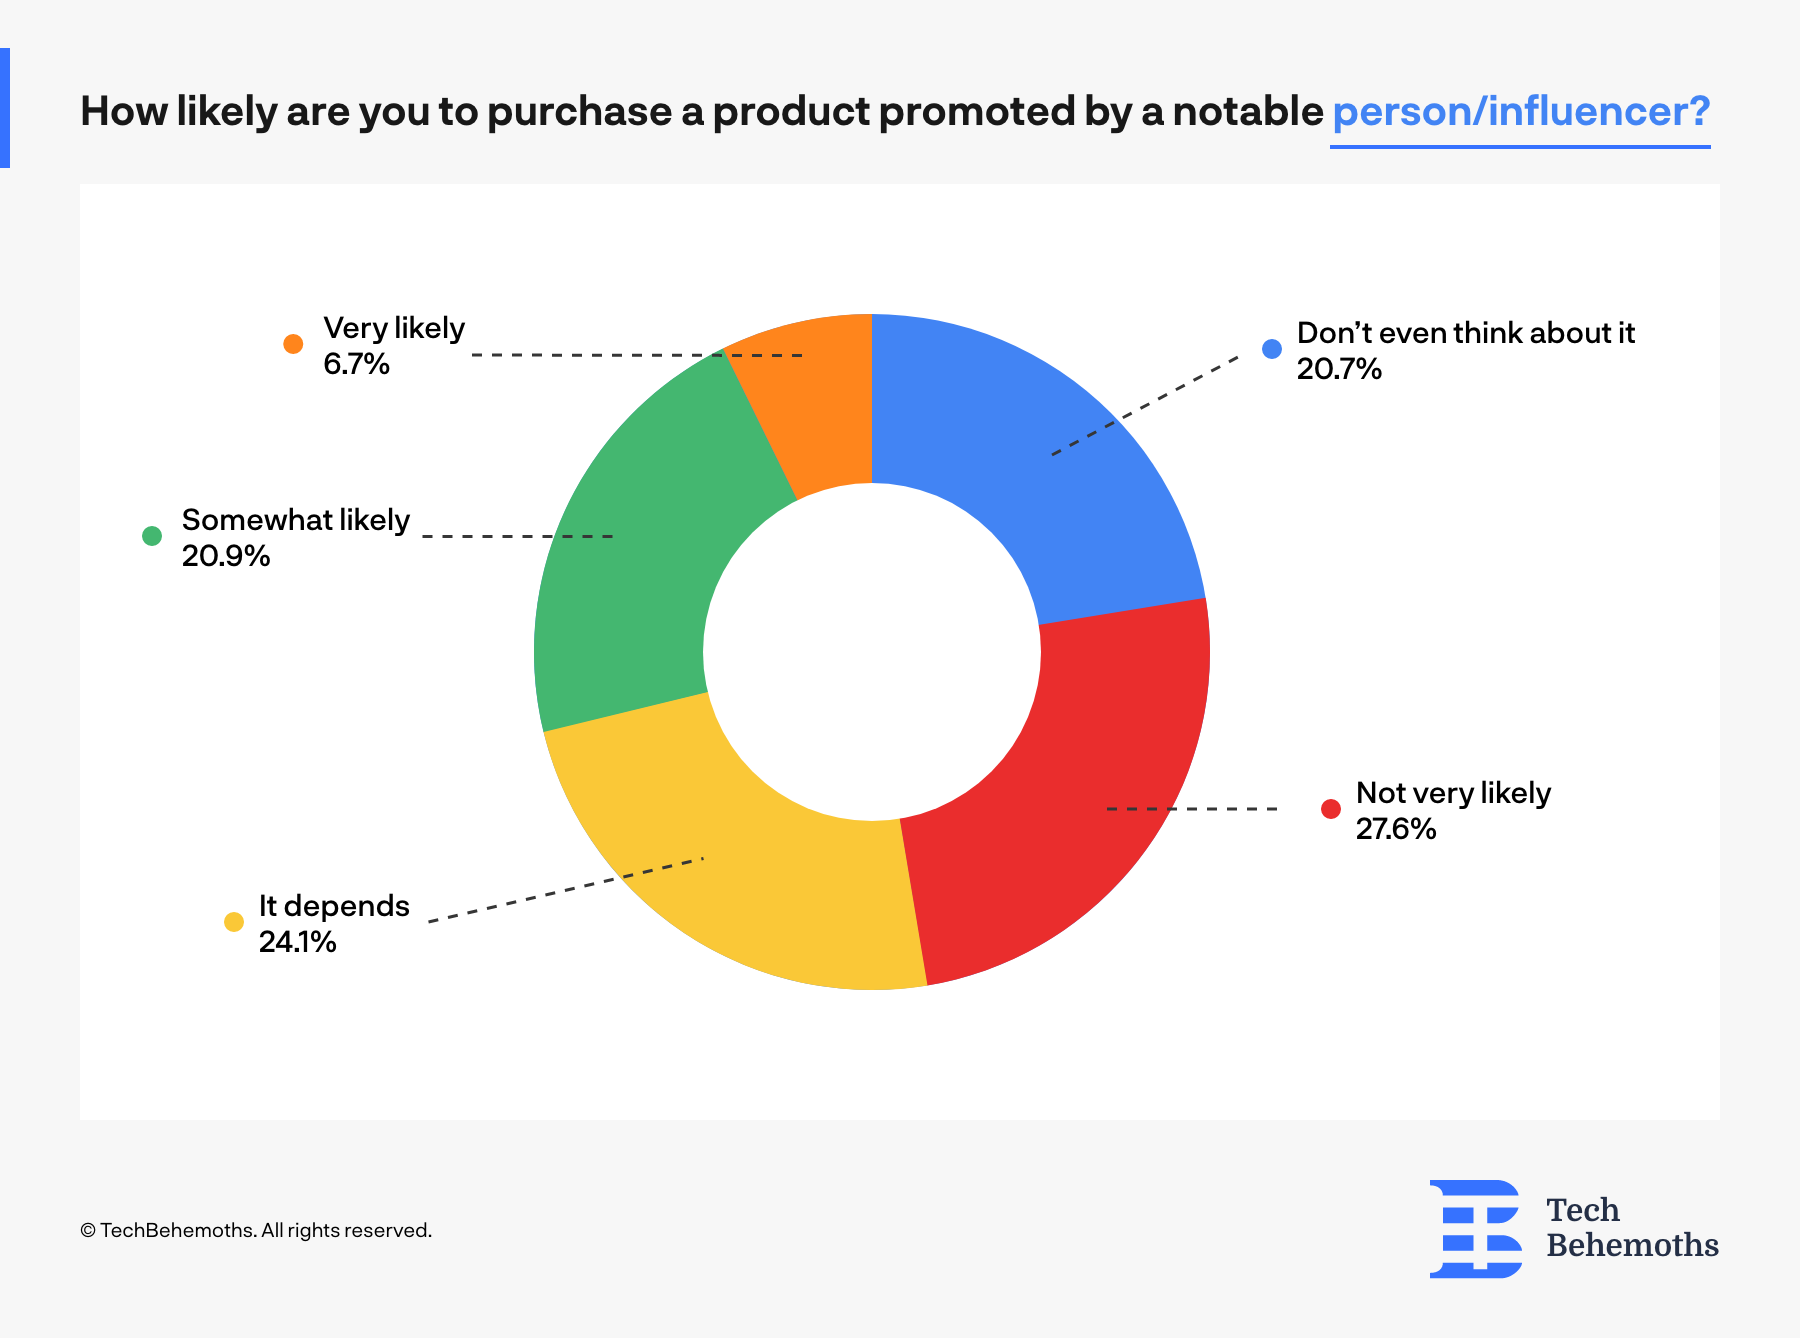
However, the largest part of respondents don’t trust influencer marketing and think that their ads don’t deserve consumer trust. A total of 48.3% consider influencer advertising unreliable at all or less reliable than other ad sources. The question that rises after these responses is do social network ads make influencers less credible, or do influencers destroy social network credibility?!
Can consumers control ads?
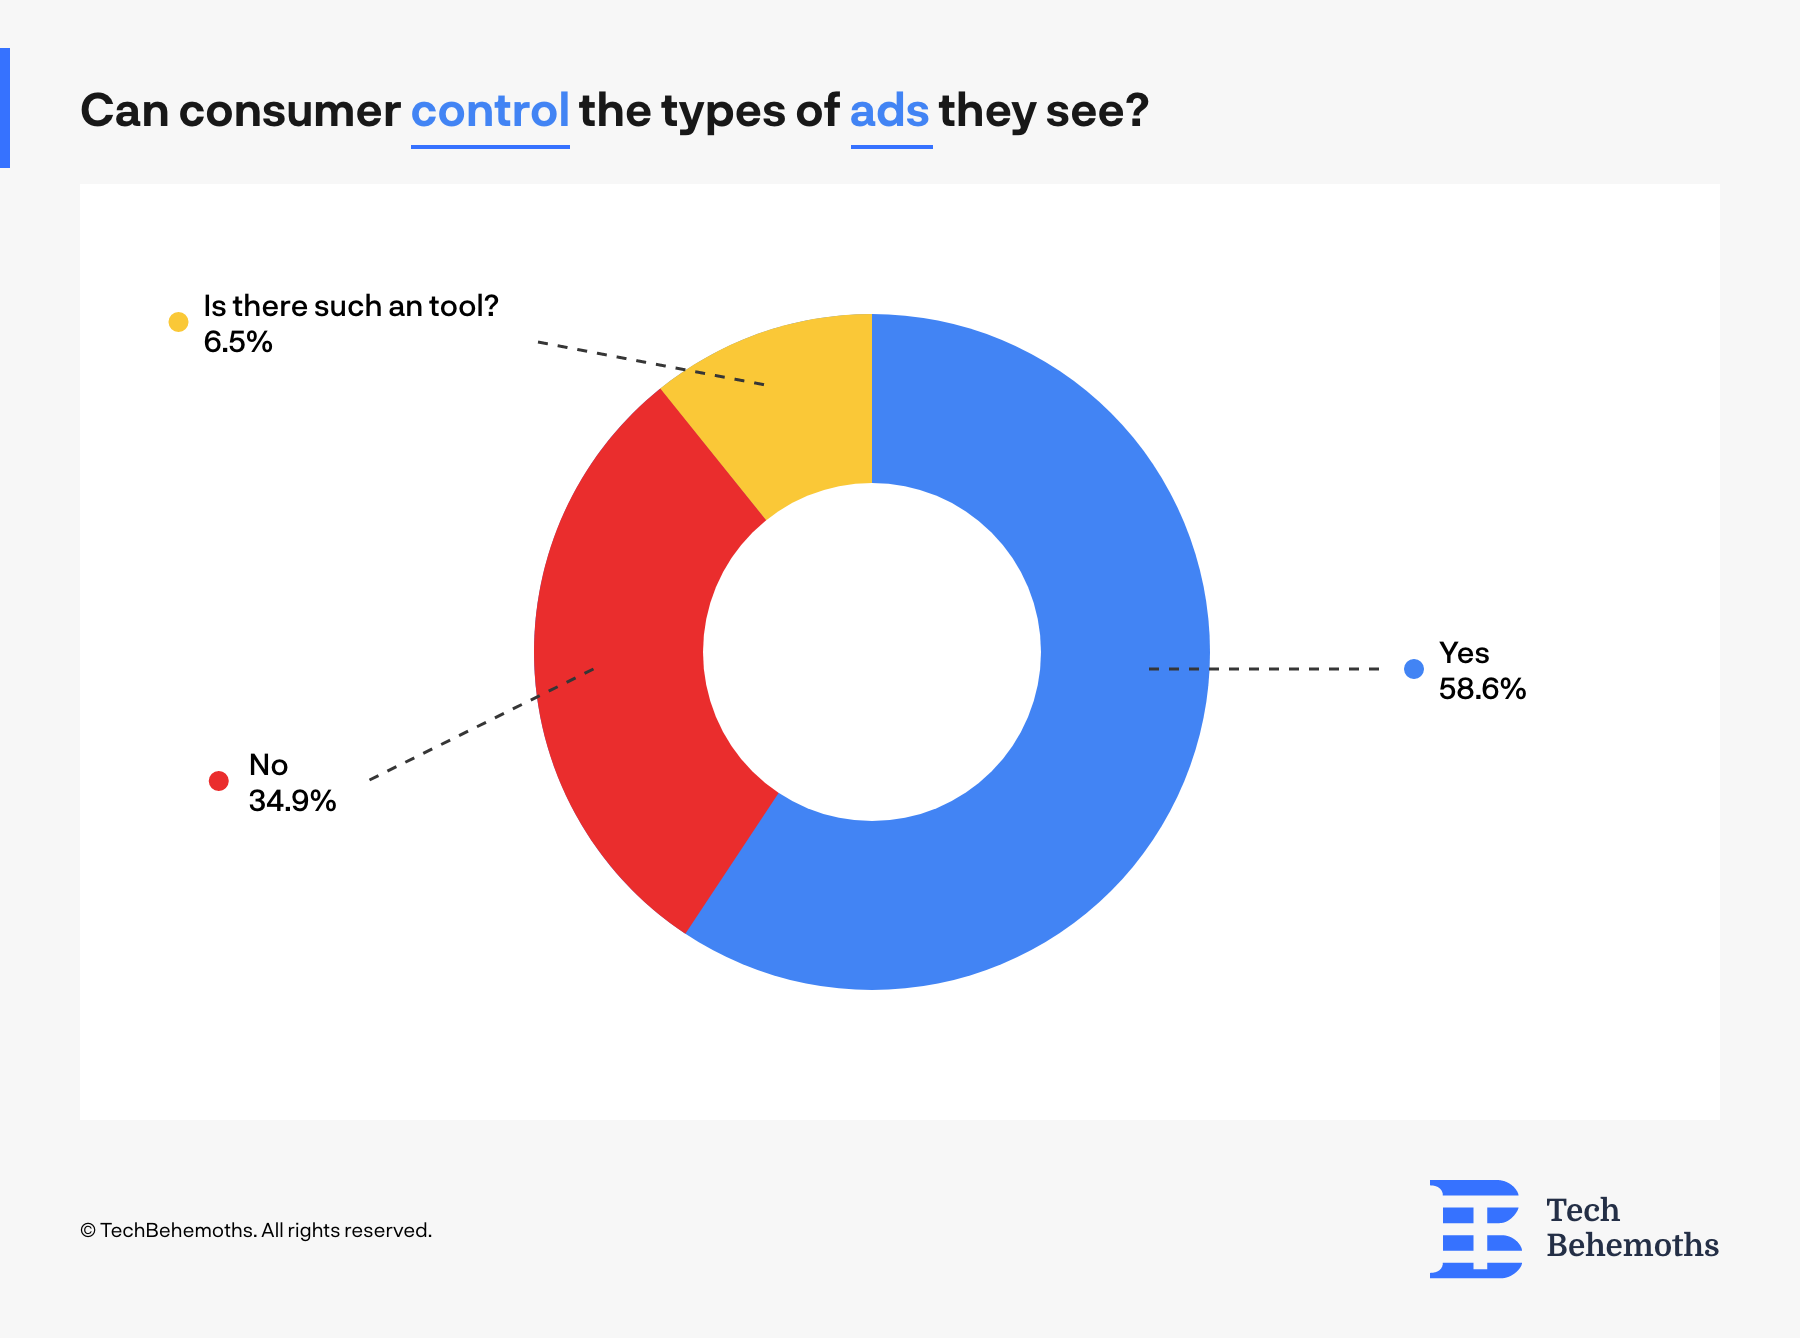
Based on survey results 58.6% think they control the type of ads they see. This is connected to both ad blocker tools and reporting ads as inappropriate. But also, spending less time on places where most of the ads are displayed - websites and social media.
On the other hand, 34.9% of survey respondents consider they don’t control the types of ads they see each day, while 6.5% don’t know/think there is such an option.
8 years ago, when Instagram started to become mainstream and influencers had almost the highest trust score, no one predicted that things would change so much in such a short period. Now, when 2022 is about to start, consumers went back where everything began - to referral recommendations, social networks, and websites.
Conclusion:
Ads are still among the highest sources of revenue for advertisers, as they continue to play an important role in consumers’ decisions. However, positions between advertising platforms and sources have changed over time, and now ads on websites and social networks have the highest volume share, and also get the highest credits to the detriment of TV, print, street, and even influencer advertisement.
According to survey participants, the biggest problem advertisers face is the ad volume. Only 10.3% of all respondents agree to see ads that have never been asked for, while the other 37.9% of respondents totally oppose being exposed to ads. But this problem for advertisers is even a bigger problem for consumers - they can’t control how many ads they see without sacrificing some choices of spending free time.
In the end, a solution to regulate ads volume, types, and products should be created between advertisers, platforms, and consumers. By sharing ad control with consumers, advertisers will gain little by little their trust back, and revenue growth.
Partner Companies
The How Ads Impact Consumers survey was performed between November 1-30, 2021 by TechBehemoths. A special role in this survey had 25 IT companies and agencies that contributed to this survey by answering questions and sharing them to general public:
- Fun Media, Kenya - https://funmedia.co.ke/
- PixoLabo, Canada/Japan - https://pixolabo.com
- D Cloud Solutions, India - www.dclouds.in
- Meira Productivity, Argentina - www.meiraproductivity.com
- OM Partnership, United States - www.ompartnership.com
- Camberlion, United States - https://camberlion.com/
- BBDS Design, China - bbdsdesign.com
- IQ Brain Technologies, India - https://www.iqbrain.in
- Talk Out Loud, United States - https://talkoutloud.biz/
- Graphiters, Pakistan - Graphiters.com
- KeyUA, Ukraine - https://keyua.org/
- BeTranslated, Belgium - https://www.betranslated.com
- Arbisoft, Pakistan - arbisoft.com
- Elespacio, Poland - elespacio.net
- Virgin Media, United Kingdom - www.virginmedia.com
- HUSPI, Ukraine - https://huspi.com
- BroSolutions, Ukraine - https://www.brosolutions.net/
- Bridge Global, India - https://www.bridge-global.com/
- GeekBee, Hungary - geekbee.com
- IZZI Studio, Ukraine - https://izzi.studio/
- KR.Laboratories, Ukraine - https://kr-labs.com.ua
- KARMA Jack Digital Marketing, United States - https://karmajack.com/
- Sayles Industries, United States - https://www.saylesindustries.com
- YEAH! Local, United States - https://yeah-local.com/
- HypeLife Brands, United States - https://www.hypelifebrands.com