UX/UI Design Analysis Survey from Service Providers’ Perspective


With lots of alternatives available, the time to grab the attention of users is short. Therefore, a good UX/UI design is a must for businesses to increase sales and growth. It improves user experience and satisfaction. Moreover, the UX/UI design can win customers' confidence, measure success, and make or break brand recognition, especially for startups and small ventures.
TechBehemoths surveyed 1062 UX/UI design service providers in 48 countries to find out their costs, procedures, and obstacles throughout March 1-6, 2024.

Profile of Survey Respondents
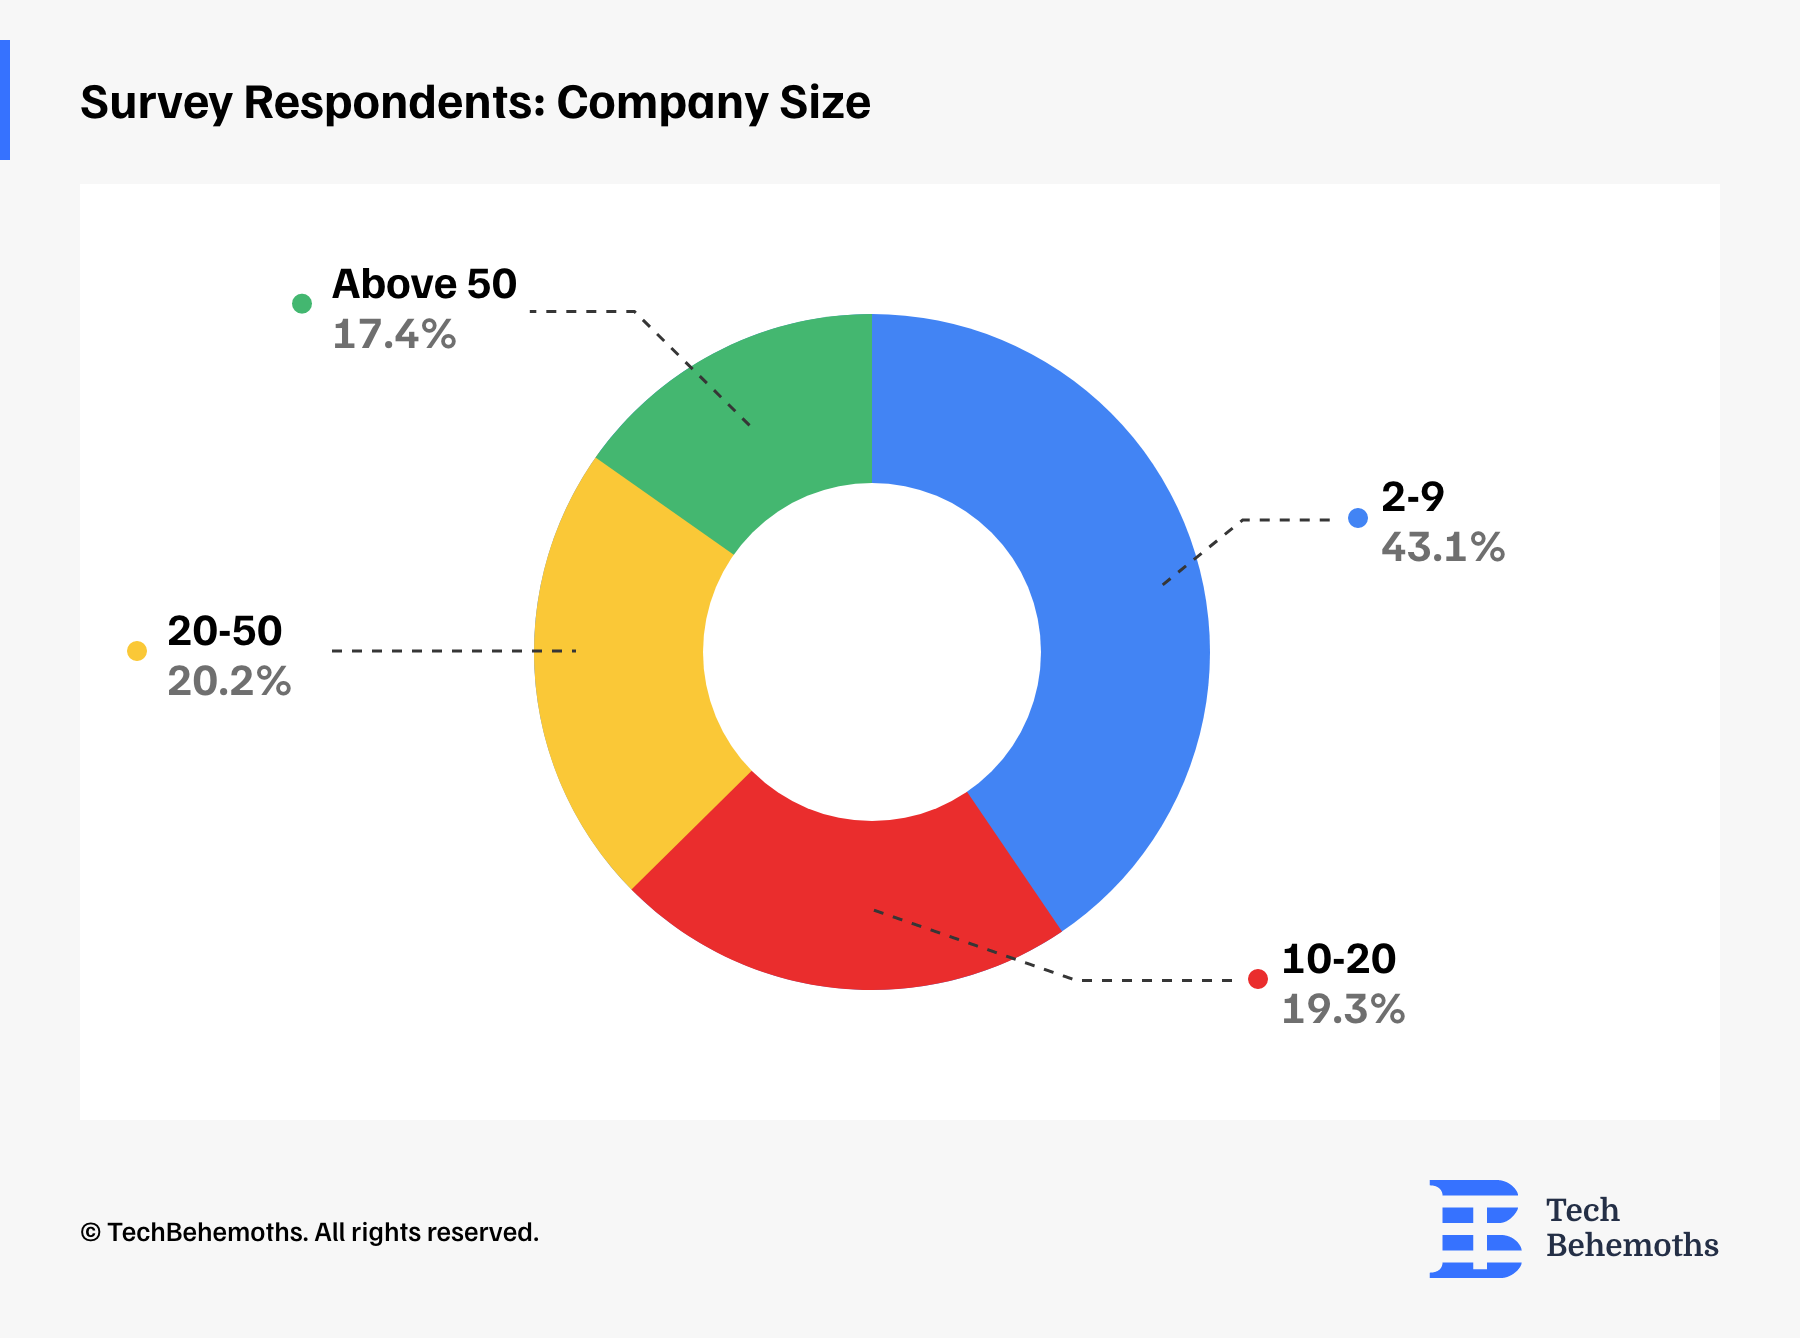
According to the survey, UX/UI design companies are distributed diversely based on their size.
The majority of the respondents belong to small businesses having 2-9 employees, which accounts for 43.1% of the total respondents.
Followed by companies with 10-20 employees at 19.3%. Companies with 20-50 employees make up 20.2%, while larger companies with over 50 employees make up 17.6%.
Survey Respondents: Position Titles
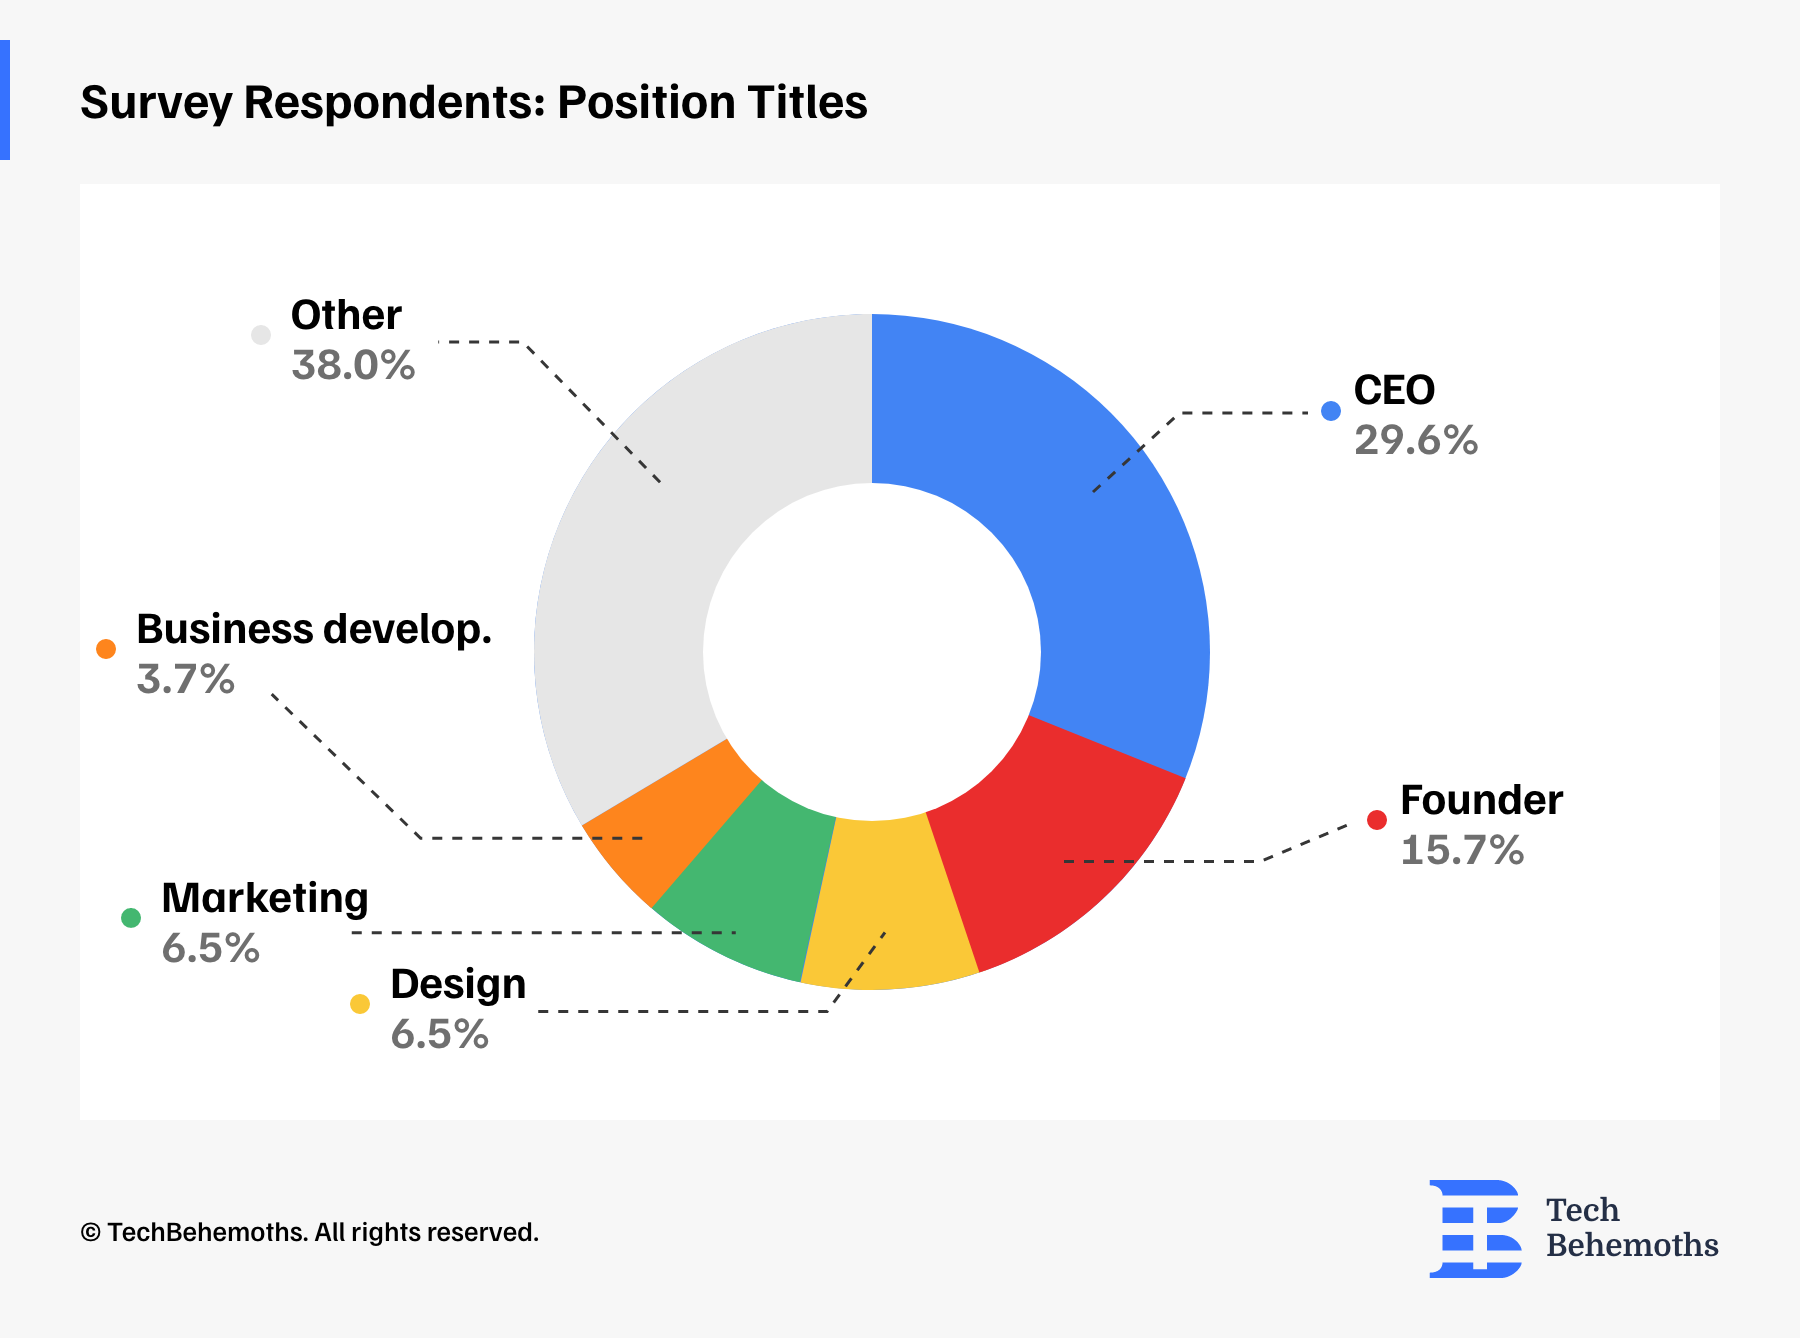
The participants in the survey held various positions within their companies.
Out of all the respondents surveyed, the majority (29.6%) were CEOs. Founders came in second position, making up 15.7% of the respondents. 6.5% of respondents held positions in both design and marketing. Business development professionals represent 3.7% of the respondents.
The other 38% of respondents said that they work as business development managers, operational managers, or in the field of digital marketing.
How long does it take companies to complete a UI/UX design project?
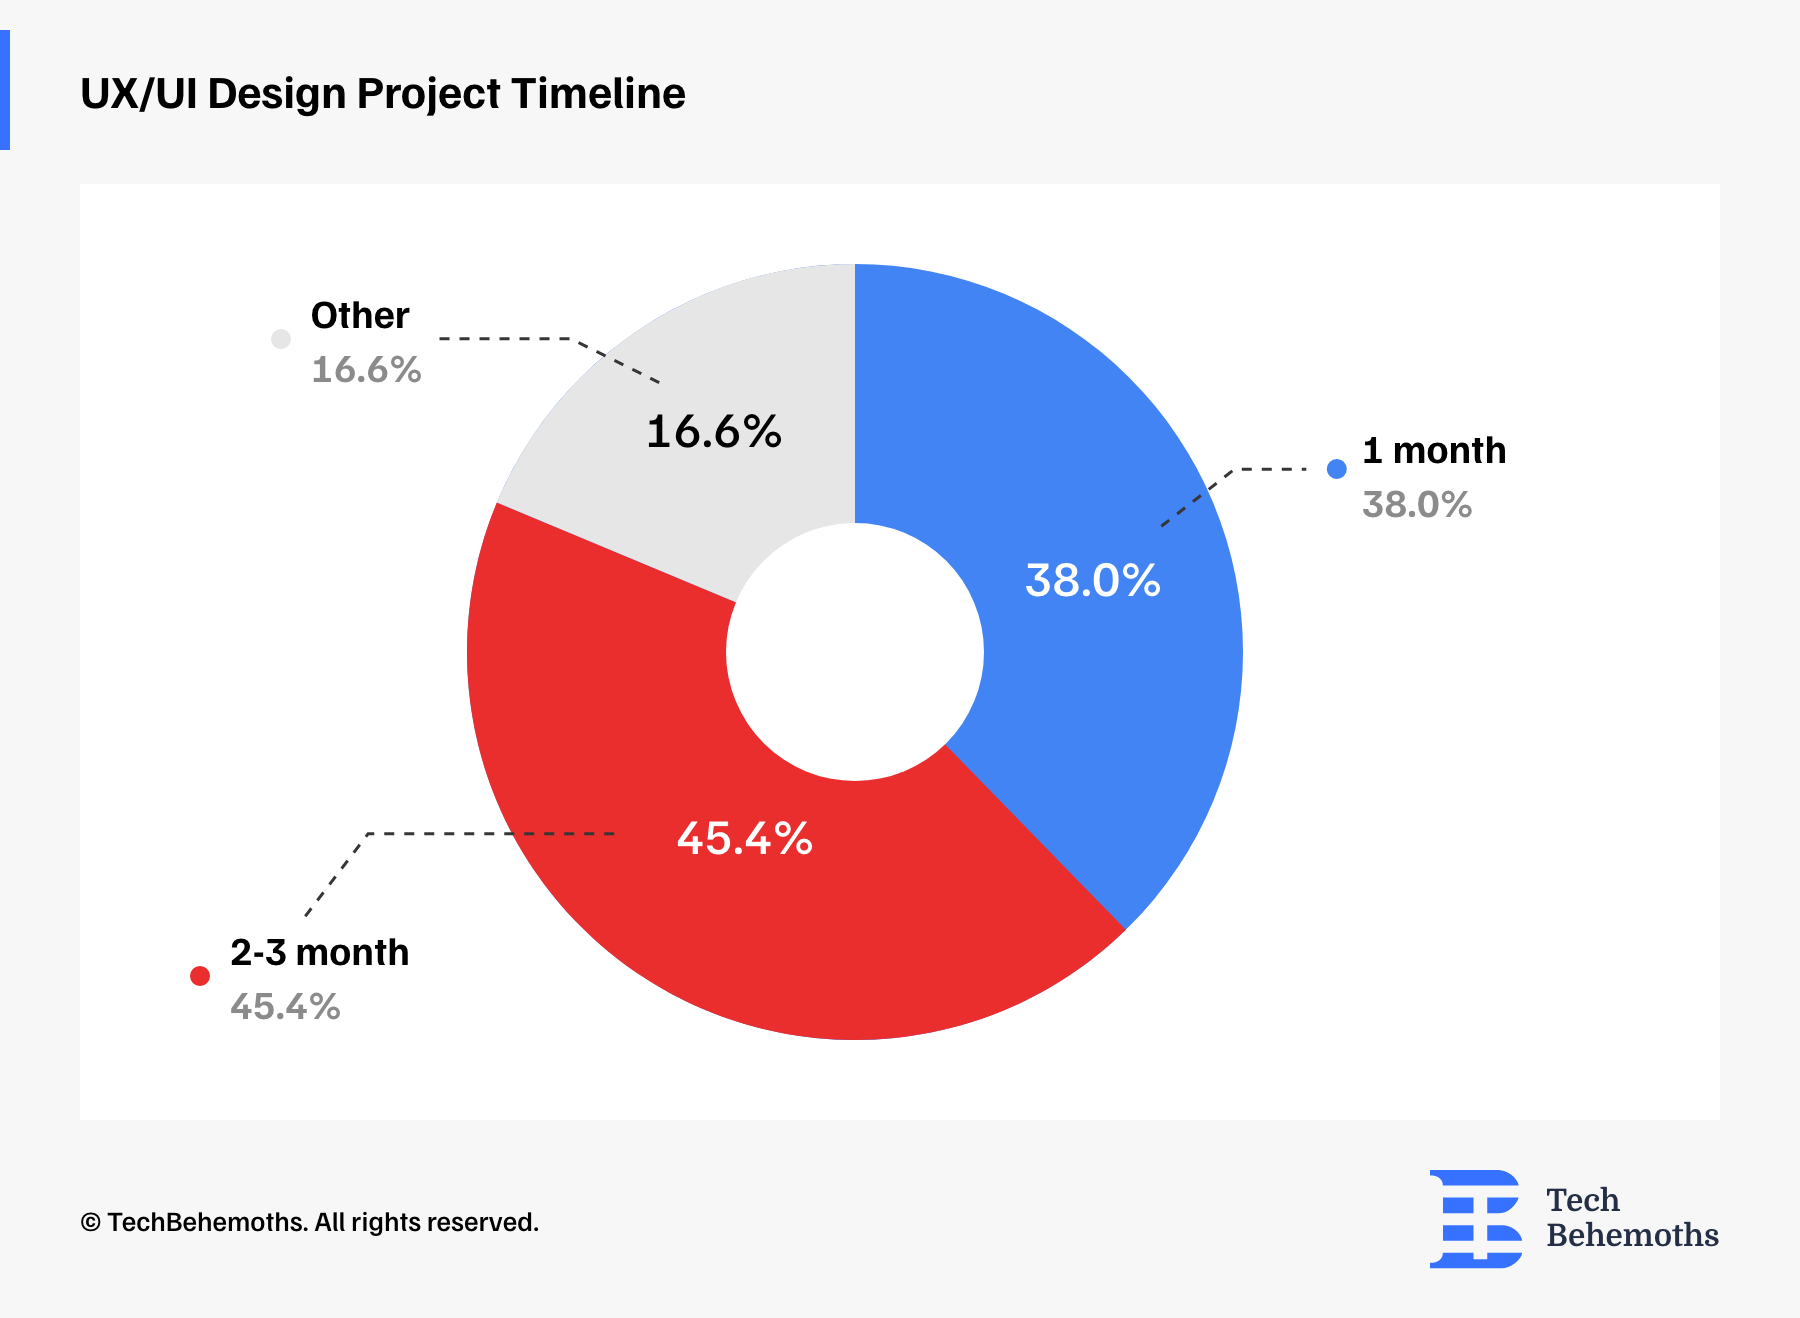
Respondents indicated different time frames for completing their projects to the question about UX/UI design project timelines.
The majority, representing 45.4% of respondents, stated that their projects typically take 2-3 months to complete. Following closely behind, 38% of participants mentioned a shorter timeframe of 1 month.
The other category, which represents 16.6% of respondents, suggests that project durations beyond the specified options depend on project requirements and complexity, while some professionals complete the project in less than a month, while others take years.
Do companies design new websites/apps or develop existing ones?
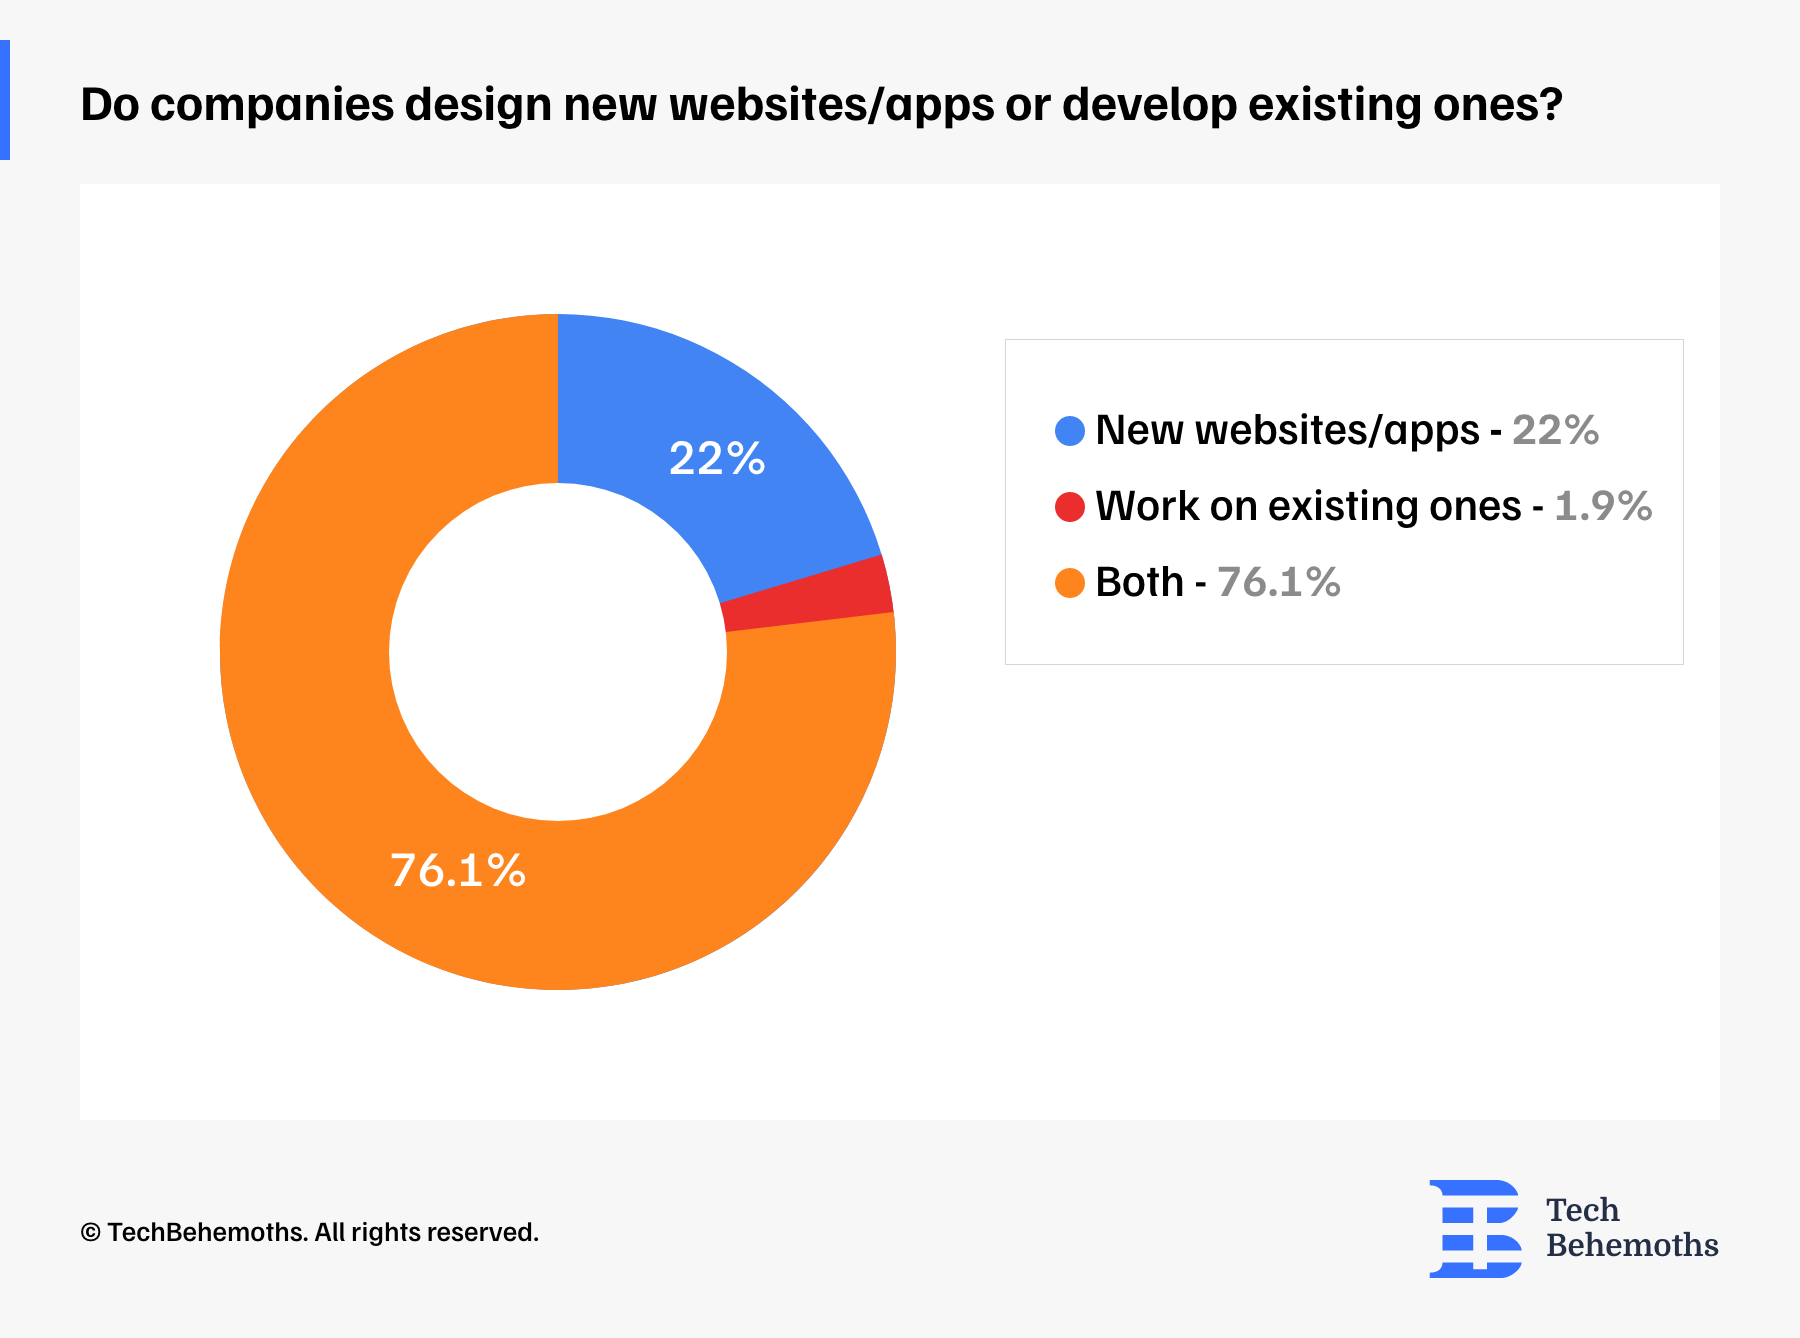
The UX/UI design analysis survey reveals that 22% of service providers focus on designing new websites and apps, while only 1.9% work exclusively on existing ones. However, the majority (76.1%) engage in both aspects.
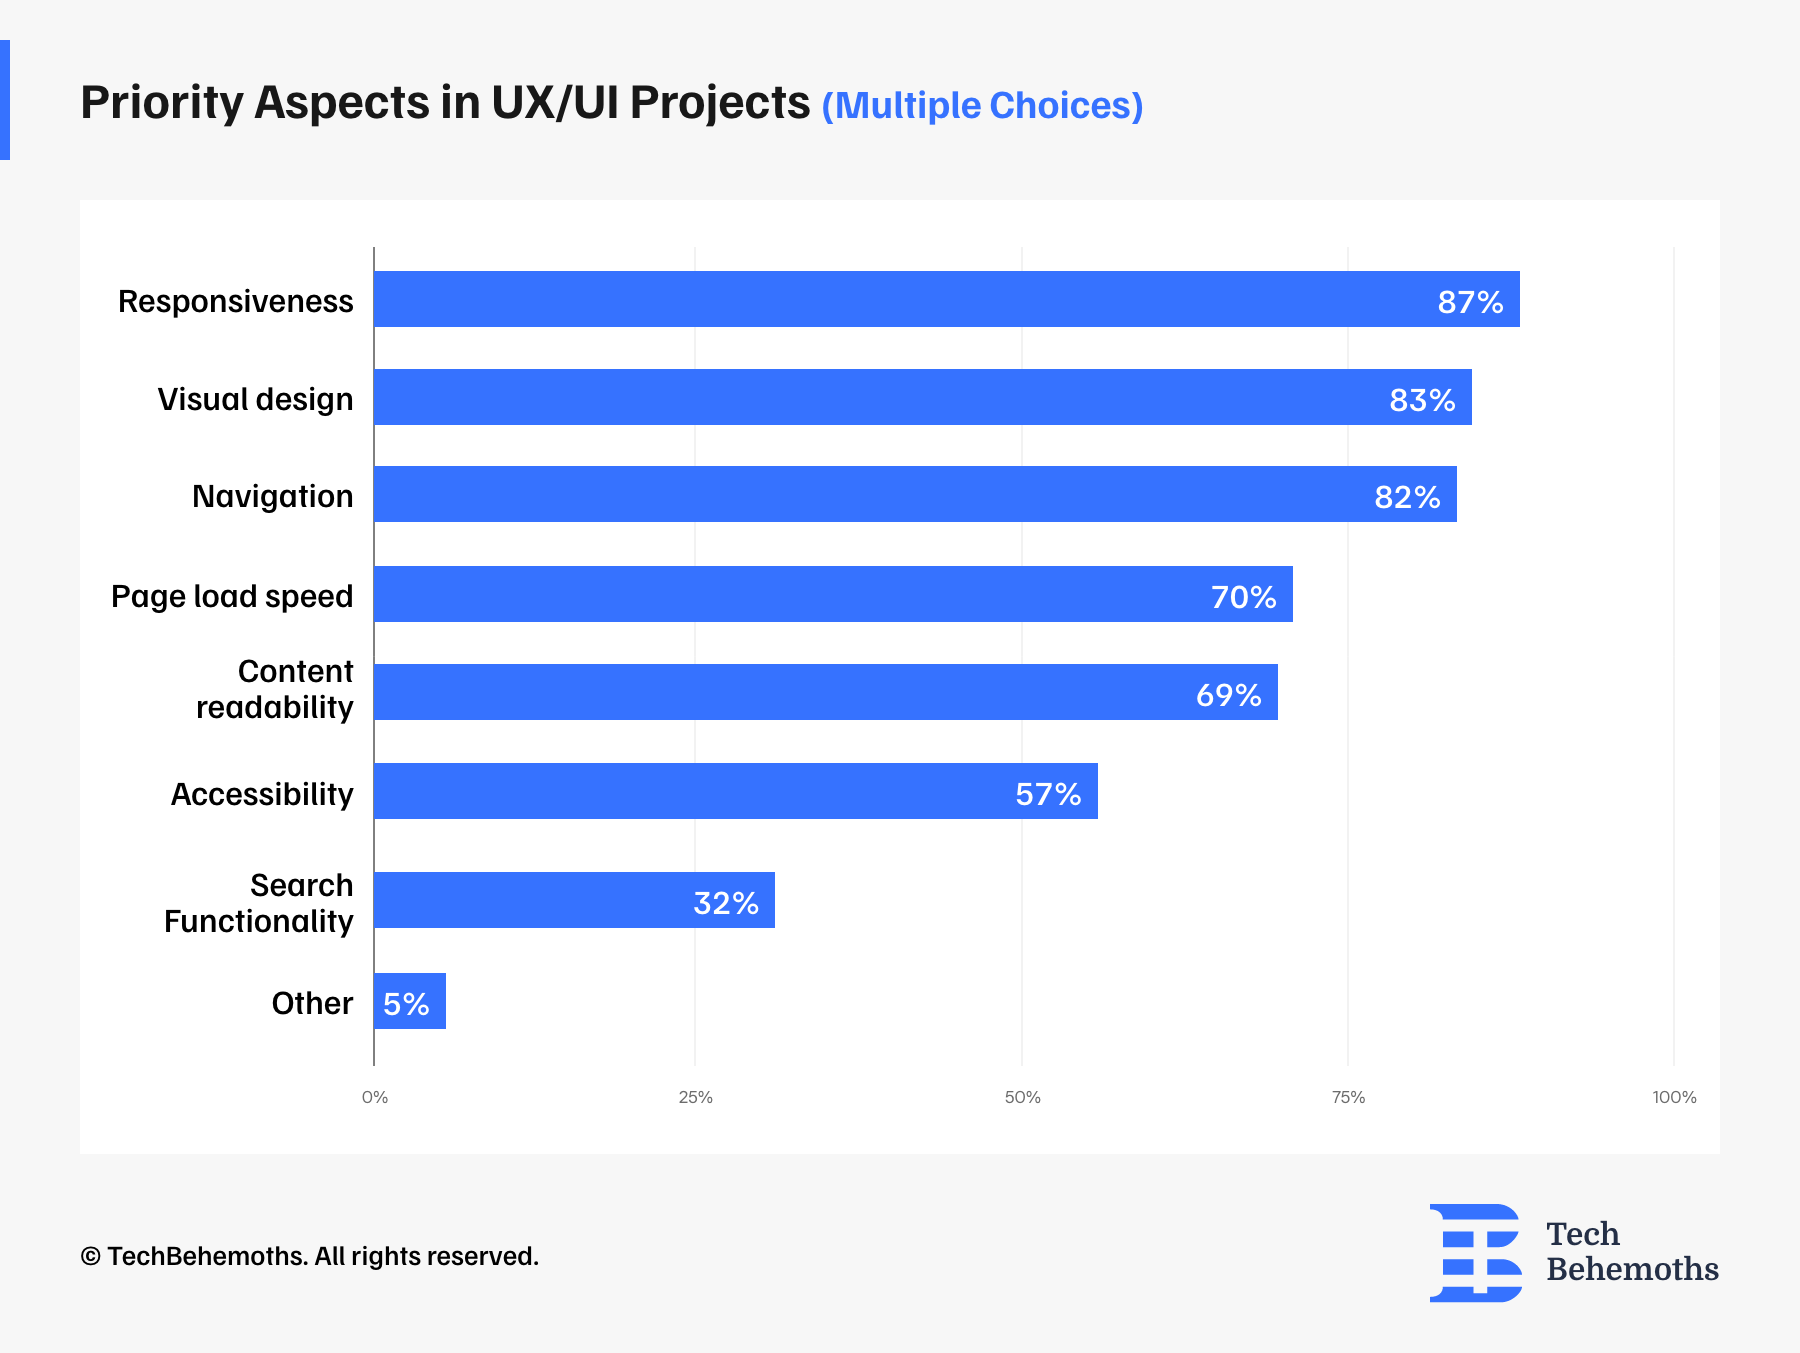
87% of Respondents consider Website Responsiveness to be the most important factor
The data survey shows that website responsiveness is the most important factor for 87% of respondents. Visual design and navigation are close to each other, with 83% and 82%. These are the three most important aspects which create a consistent brand experience across devices and craft visual and aesthetic qualities of the user interface.
Page load speed and content readability are a priority for 70% and 69% of respondents. Therefore, 57% represent accessibility and search functionality is slightly lower with 32%. 5% of designers mentioned other factors.
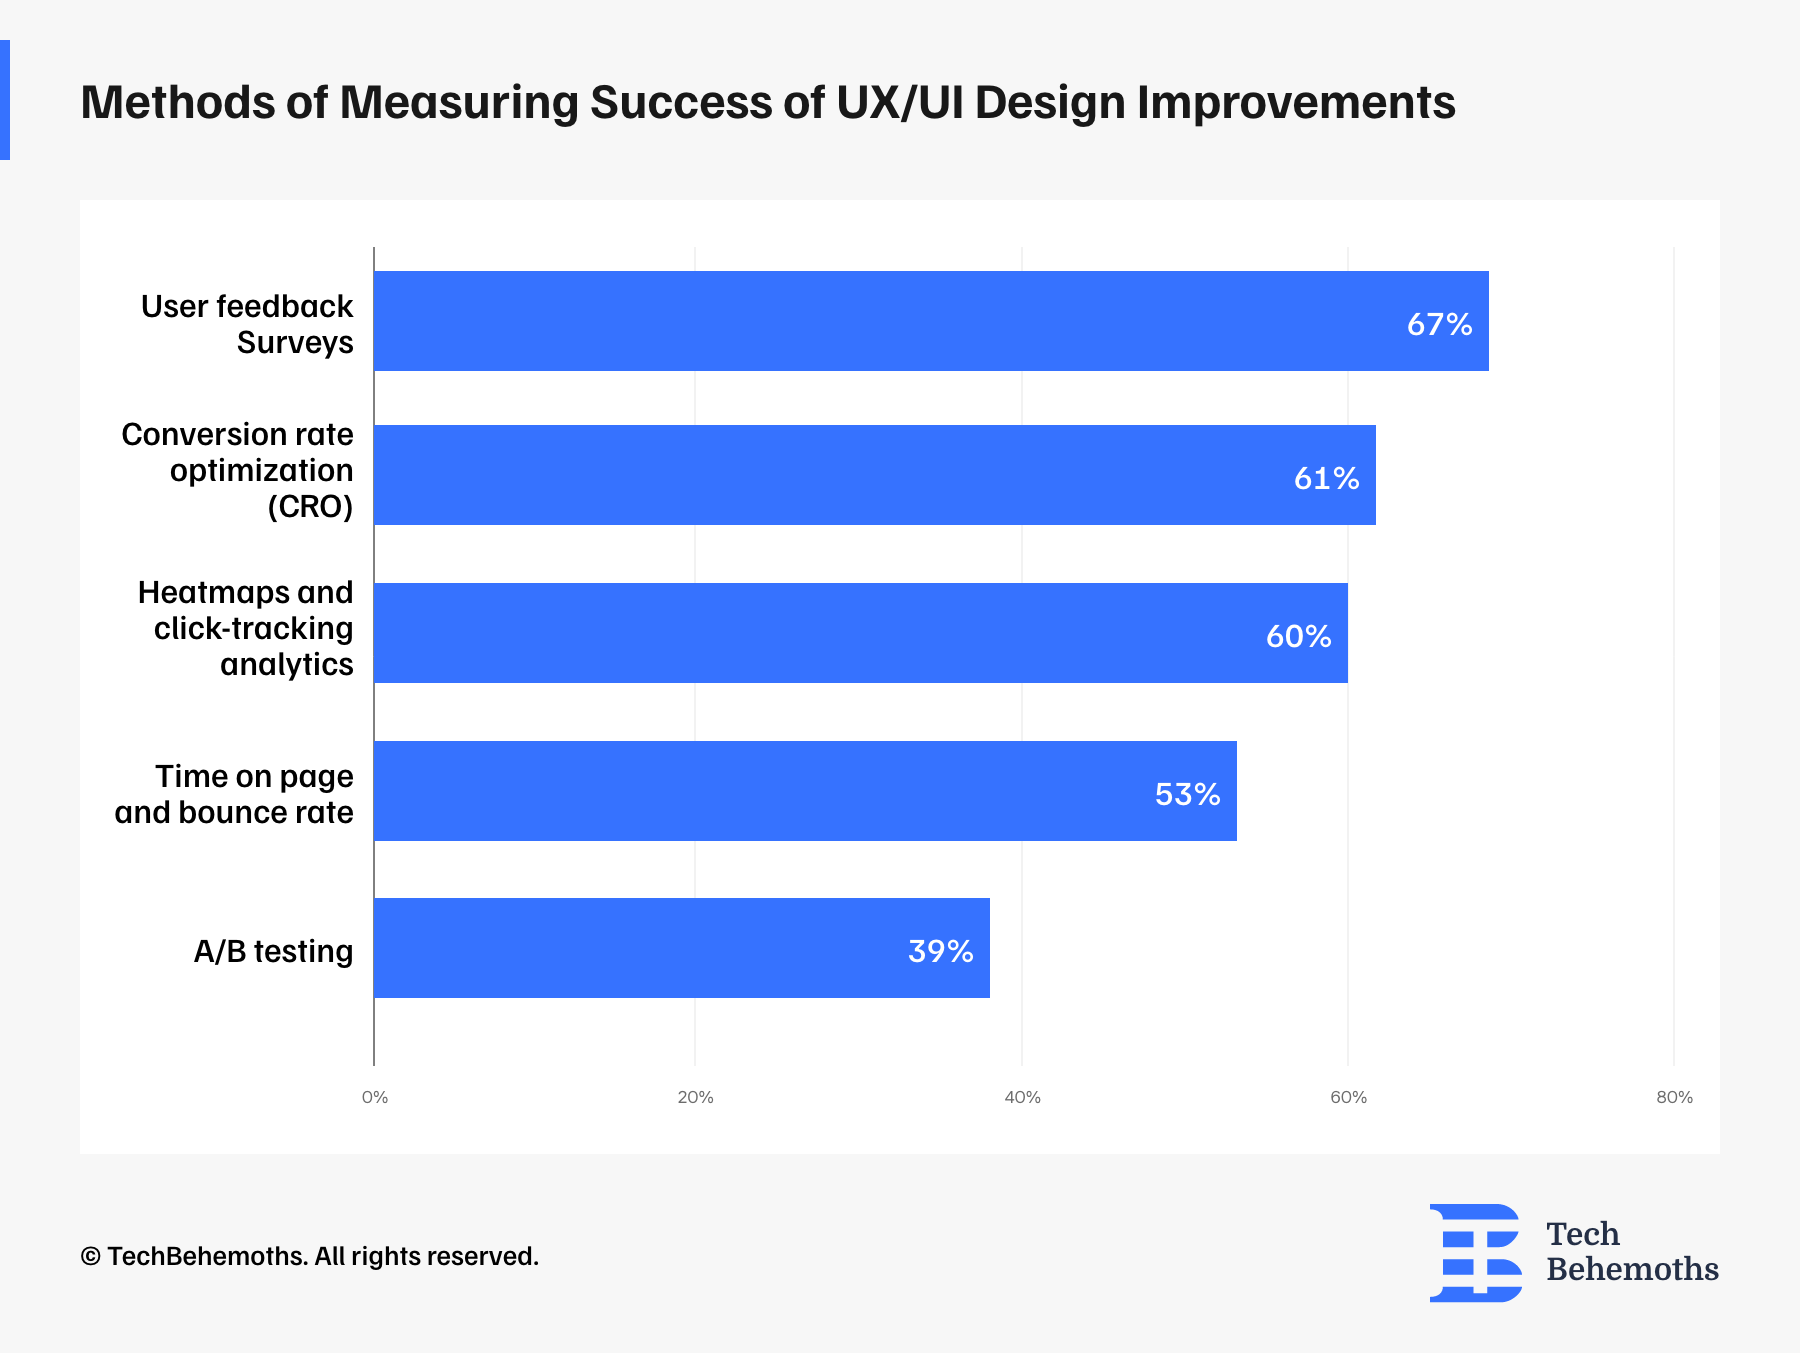
Methods of Measuring Success of UX/UI Design Improvements
The survey shows that user feedback surveys are the most common, with 67% of respondents using direct user input to make design changes.
Conversion rate optimization (CRO) is used by 61.1% of professionals to focus on business outcomes. Heatmaps and click-tracking analytics are used by 59% of professionals to gain visual insights into user interactions.
Metrics such as time on page and bounce rate are used by 53.2% of professionals to provide indicators of user engagement and retention. The use of A/B testing is also a method of comparing different versions of a webpage to determine effectiveness.
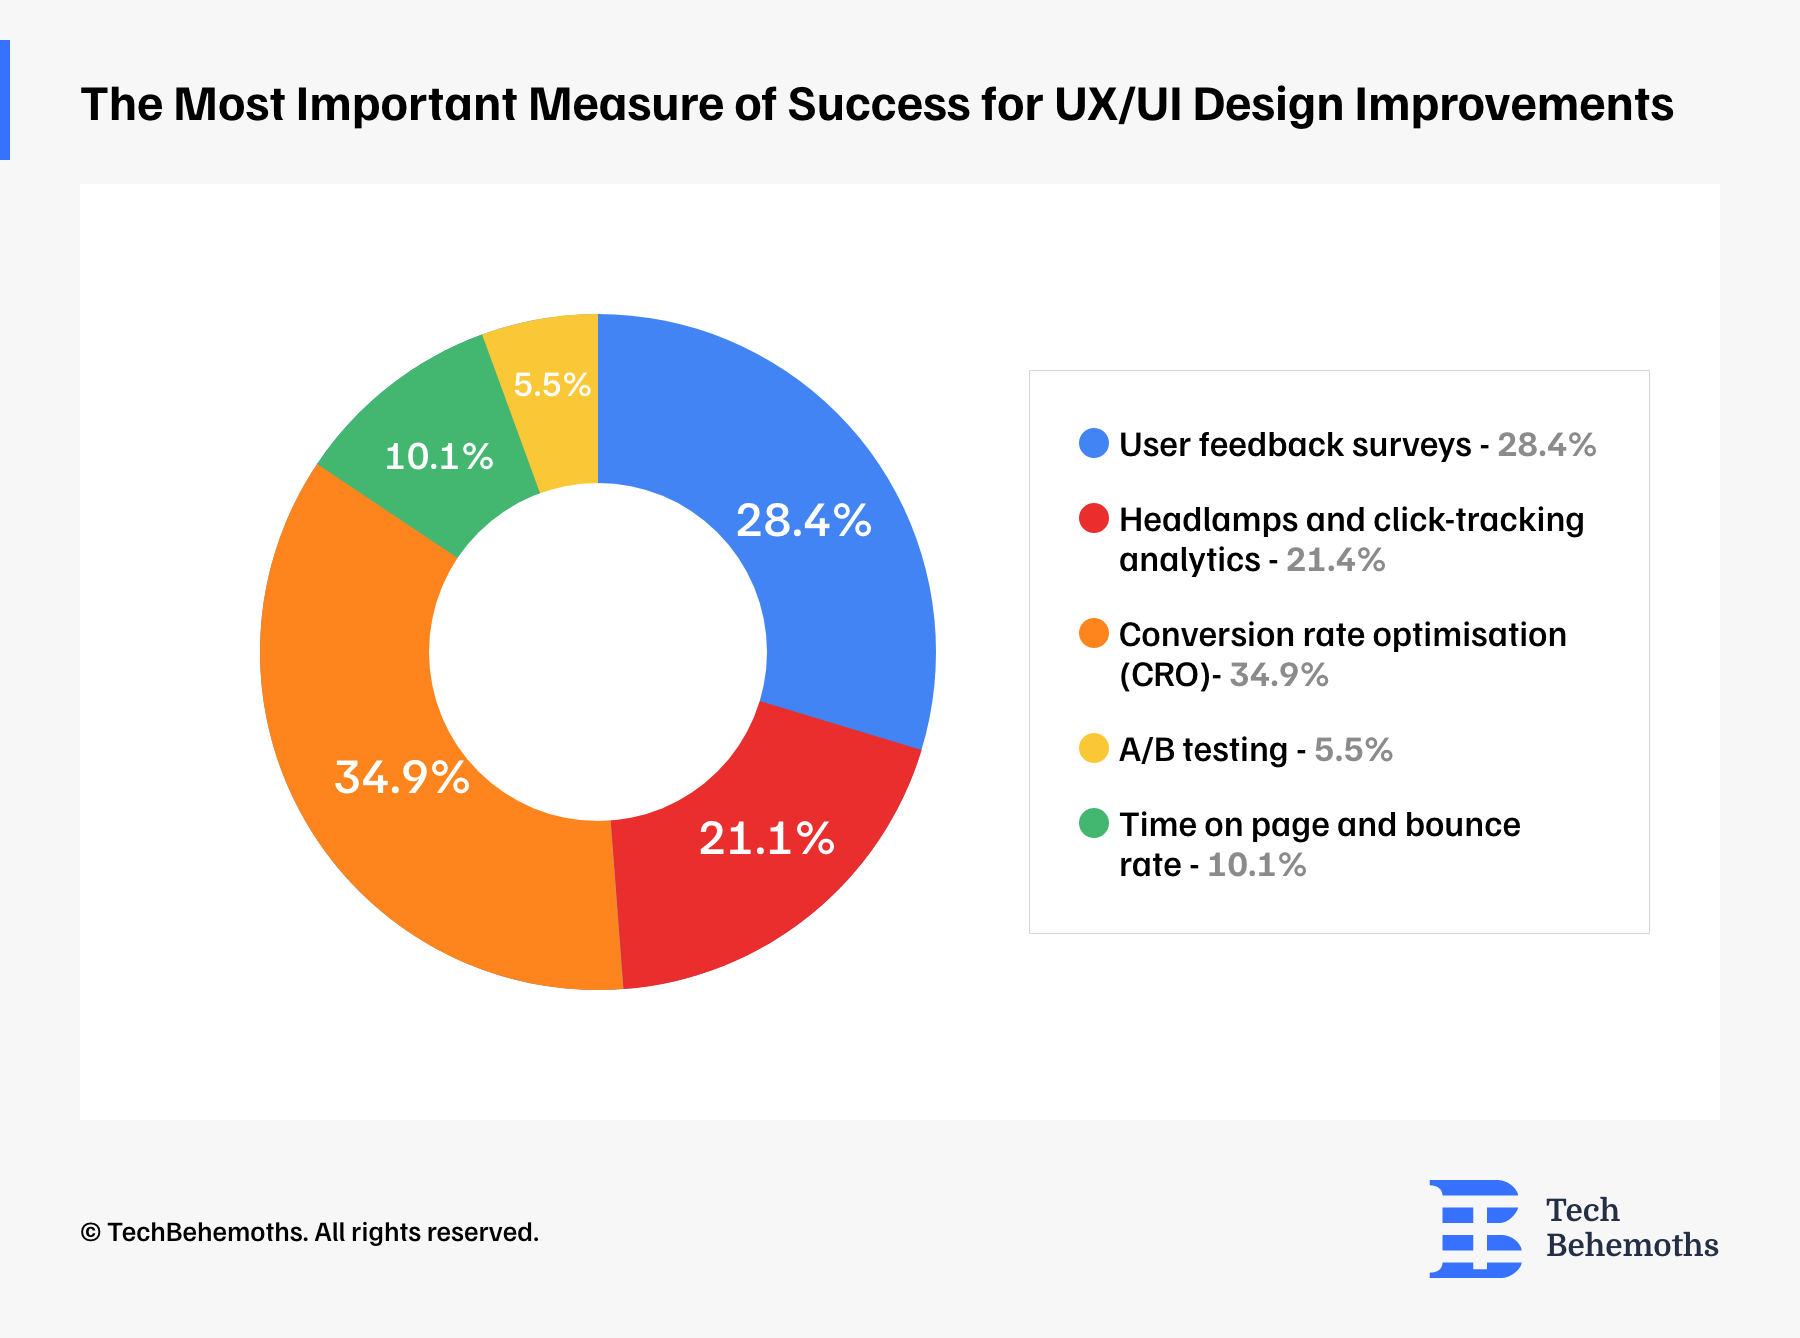
The Most Important Measure of Success for UX/UI Design Improvements
Regarding the methods used to measure success, 28.4% of respondents stated that user feedback surveys were the most reliable. However, when asked about the most important measure of success, 34.9% of respondents believe that conversion rate optimization (CRO) is the most important measure of success. This indicates business outcomes are a top priority.
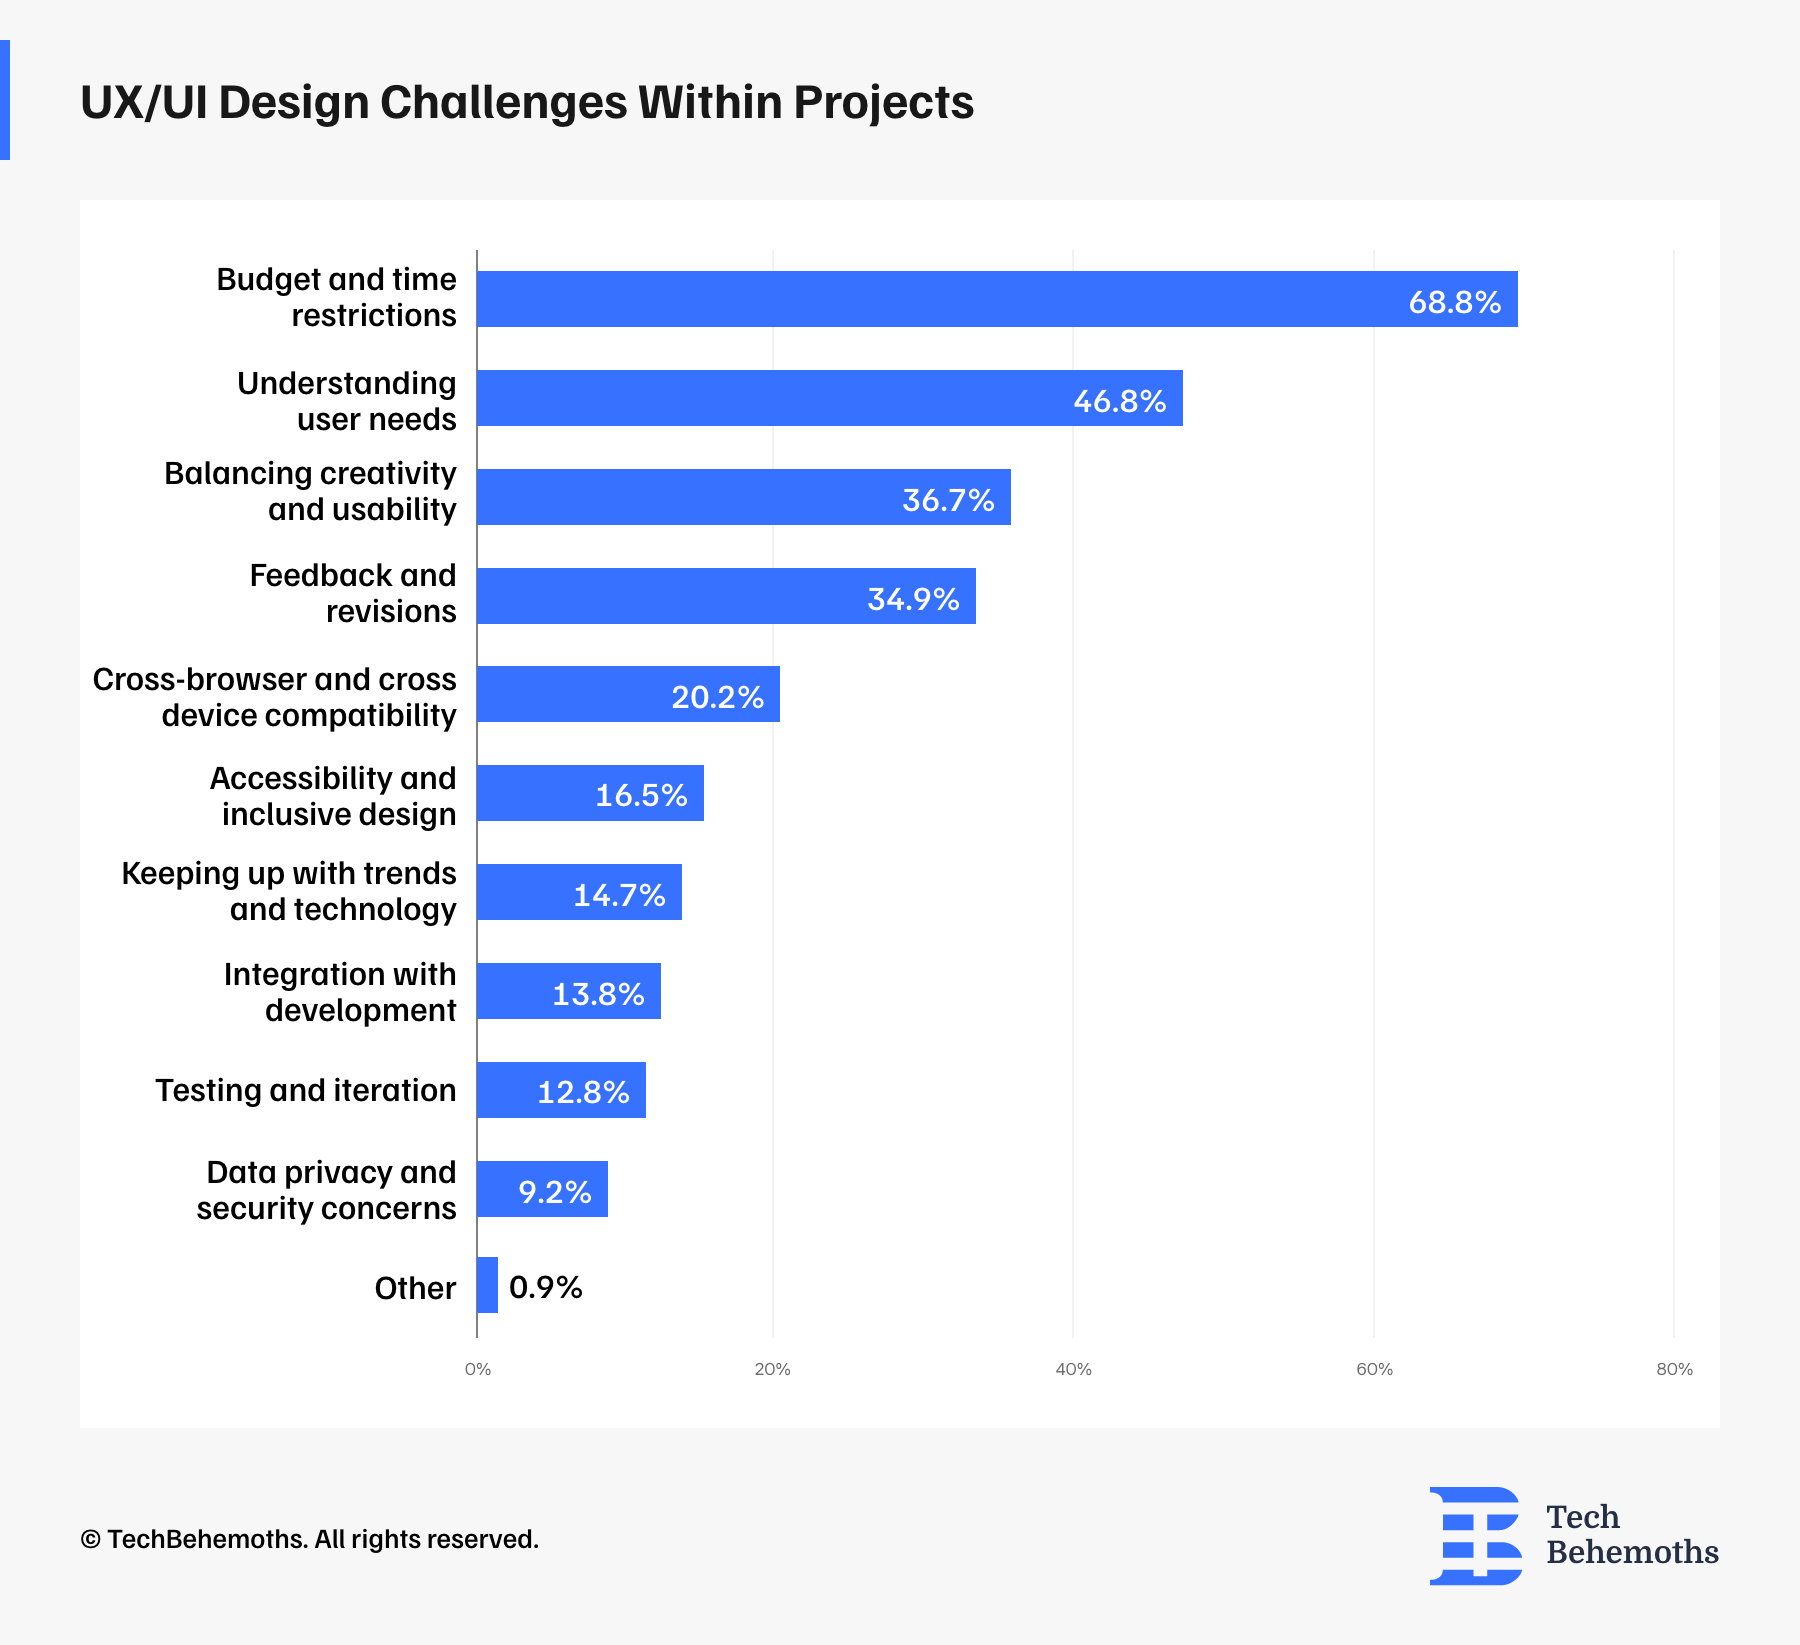
68.8% of Respondents states that the primary challenges are often Time and Budget Limitations
Creating good website designs that customers like can be challenging, as the survey shows. The biggest challenges are usually lack of time and budget, according to 68.8% of respondents. It's also important to understand what users want, which is a challenge for 46.8%.
Balancing creativity and usability is also a concern for 36.7%, but making a good design is necessary. Feedback and revisions can also be difficult processes for 34.9%, which is normal in the design process.
Technical factors like cross-browser and cross-device compatibility (20.2%), accessibility and inclusive design (16.5%), and integration with development (13.8%) contribute to the complexity of the UX/UI design field.
Keeping up with trends and technology, testing and iteration, and addressing data privacy and security concerns are also seen as challenges. This is because the UX/UI design field is always changing and growing.
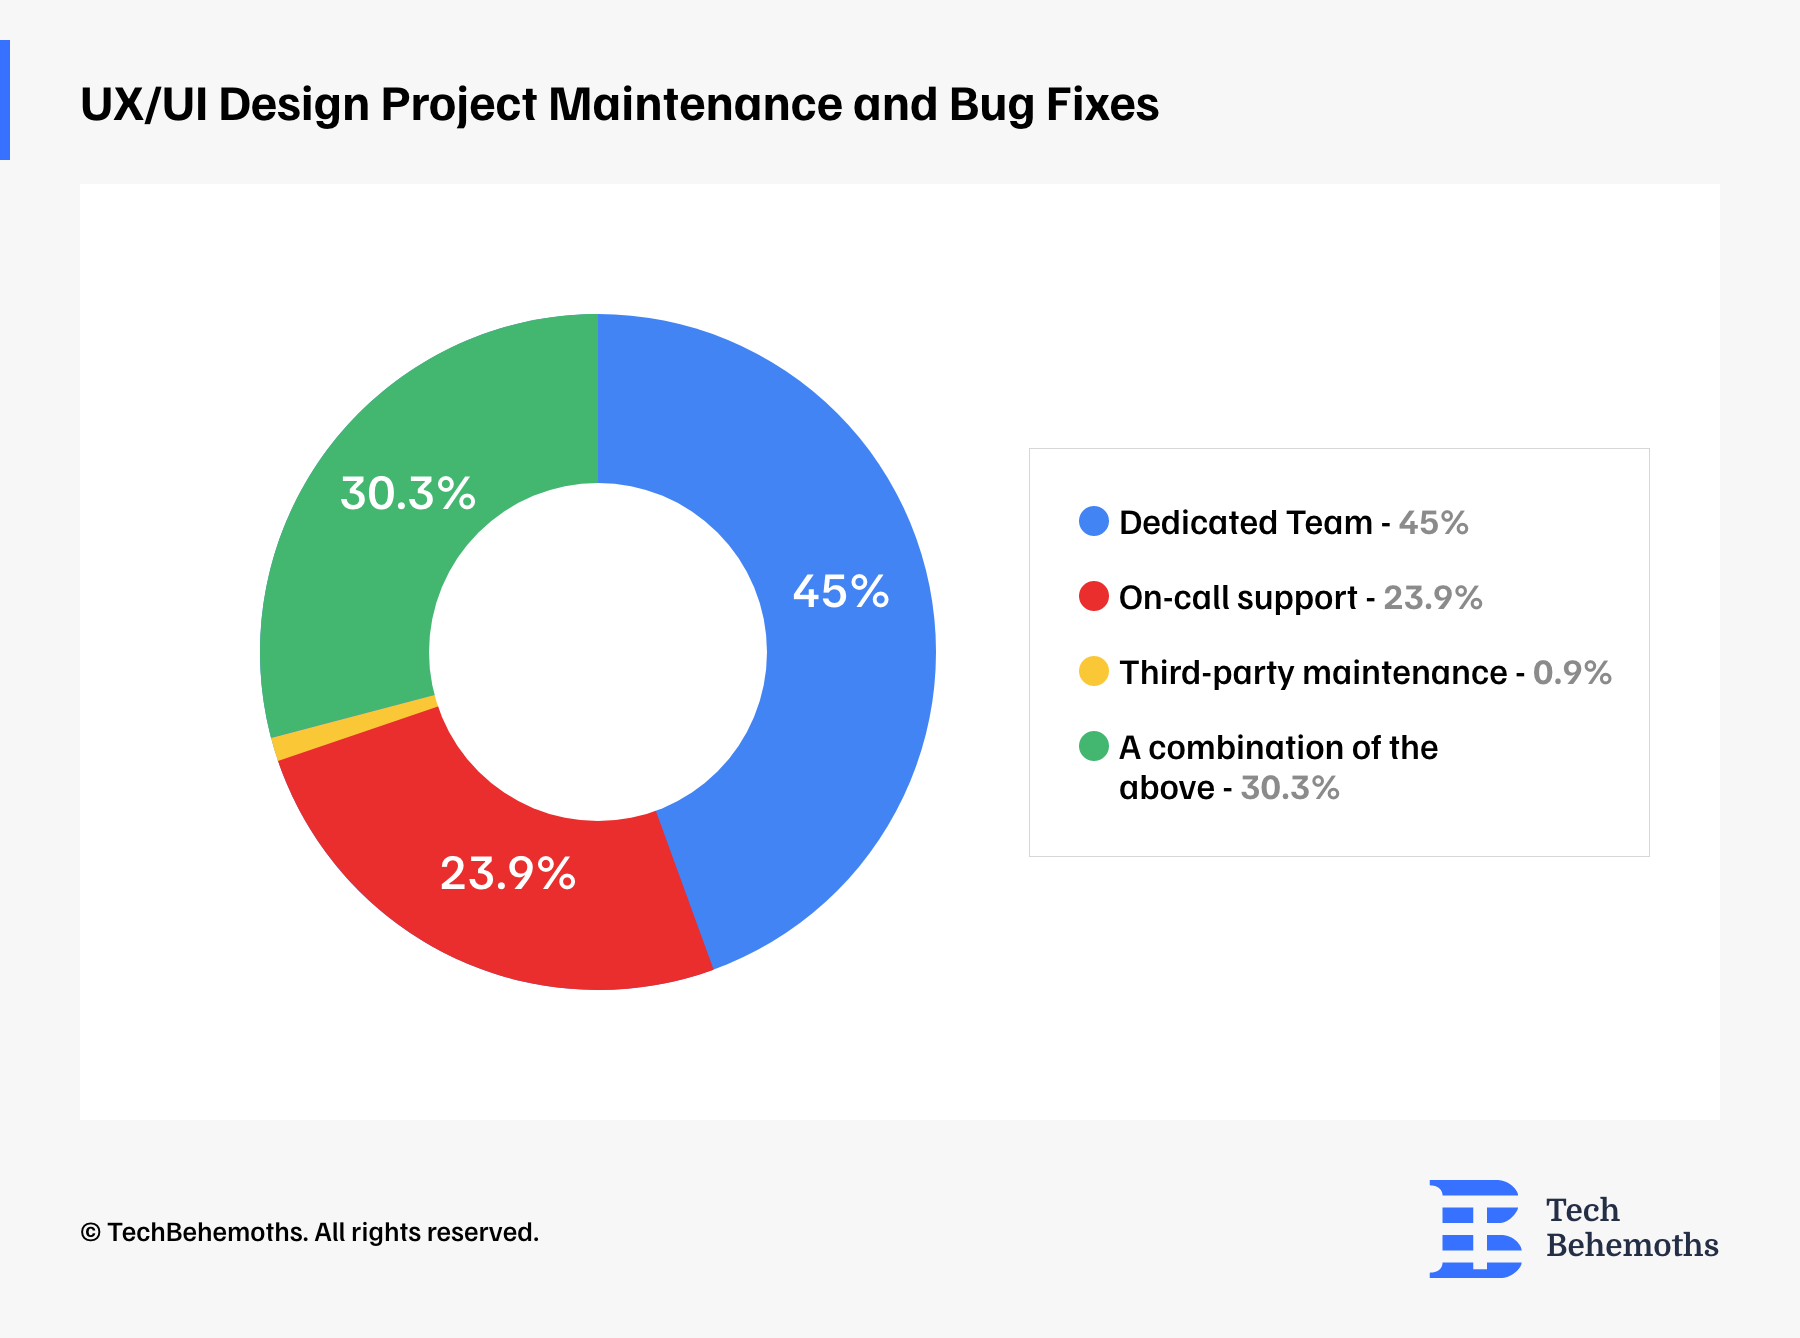
How do companies handle ongoing maintenance and bug fixes for their UX/UI design project?
To understand when to prepare for product testing and release, it is important to understand the project lifecycle and development stages.
According to our survey data, 45% prefer a dedicated team, 23.9% use on-call support, and 30.3% use a combination of both. Only 0.9% rely on third-party maintenance. Web maintenance means more than having a functional live site. It implies constant updates, monitoring, security, performance and so on. Teams can adjust their maintenance strategies based on project needs and resources available.
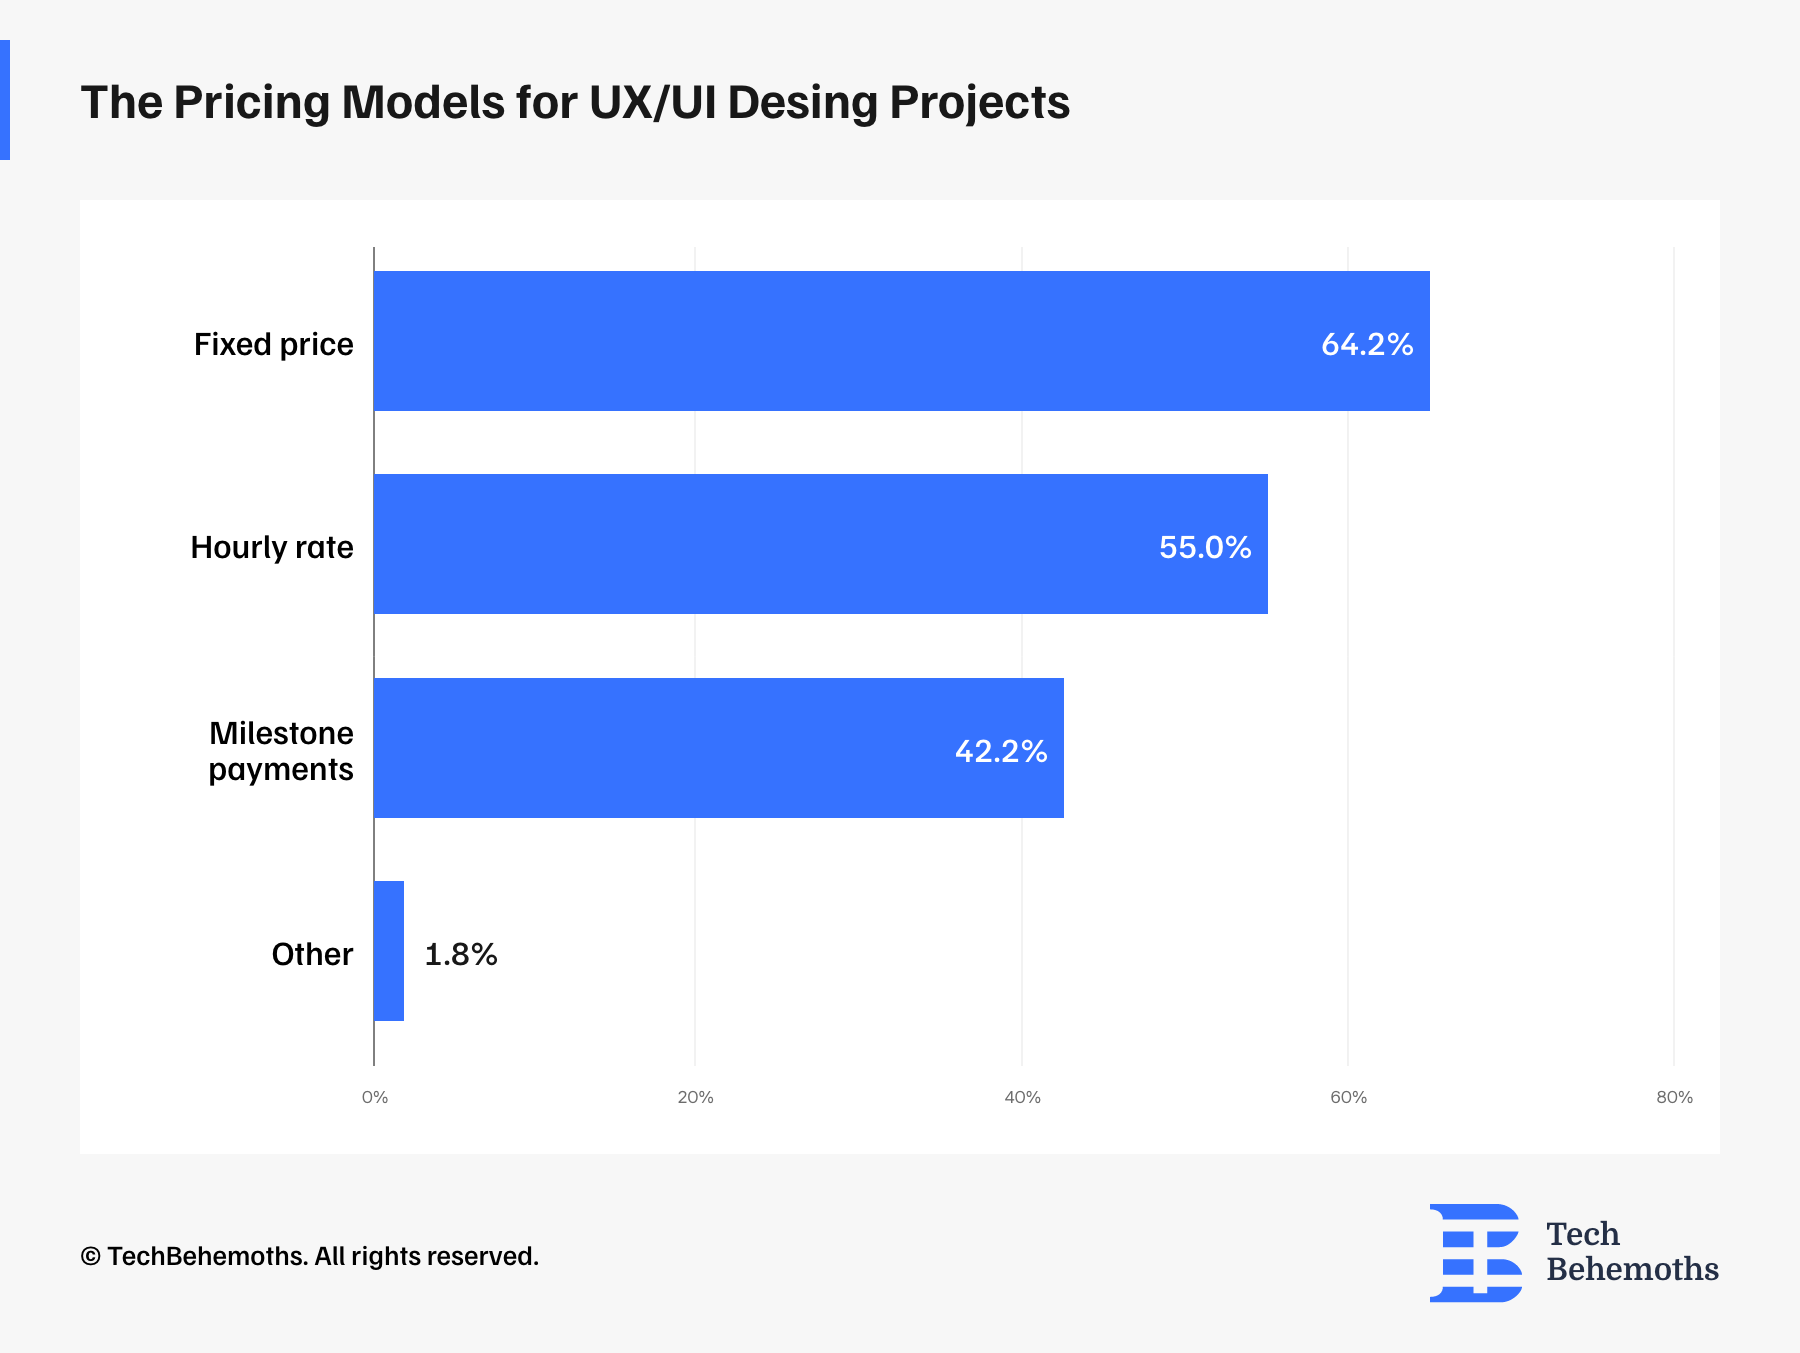
The Pricing Models for UX/UI Desing Projects
UX/UI design professionals use different pricing models. The most popular one is fixed-price, chosen by 64.2% of respondents. This model provides the total project cost upfront. 55% of respondents prefer an hourly rate approach, where the cost is based on the time spent on the project.
Also, 42.2% of respondents prefer milestone payments, where payments are aligned with specific project achievements or stages. Only 1.8% of respondents use alternative pricing models.
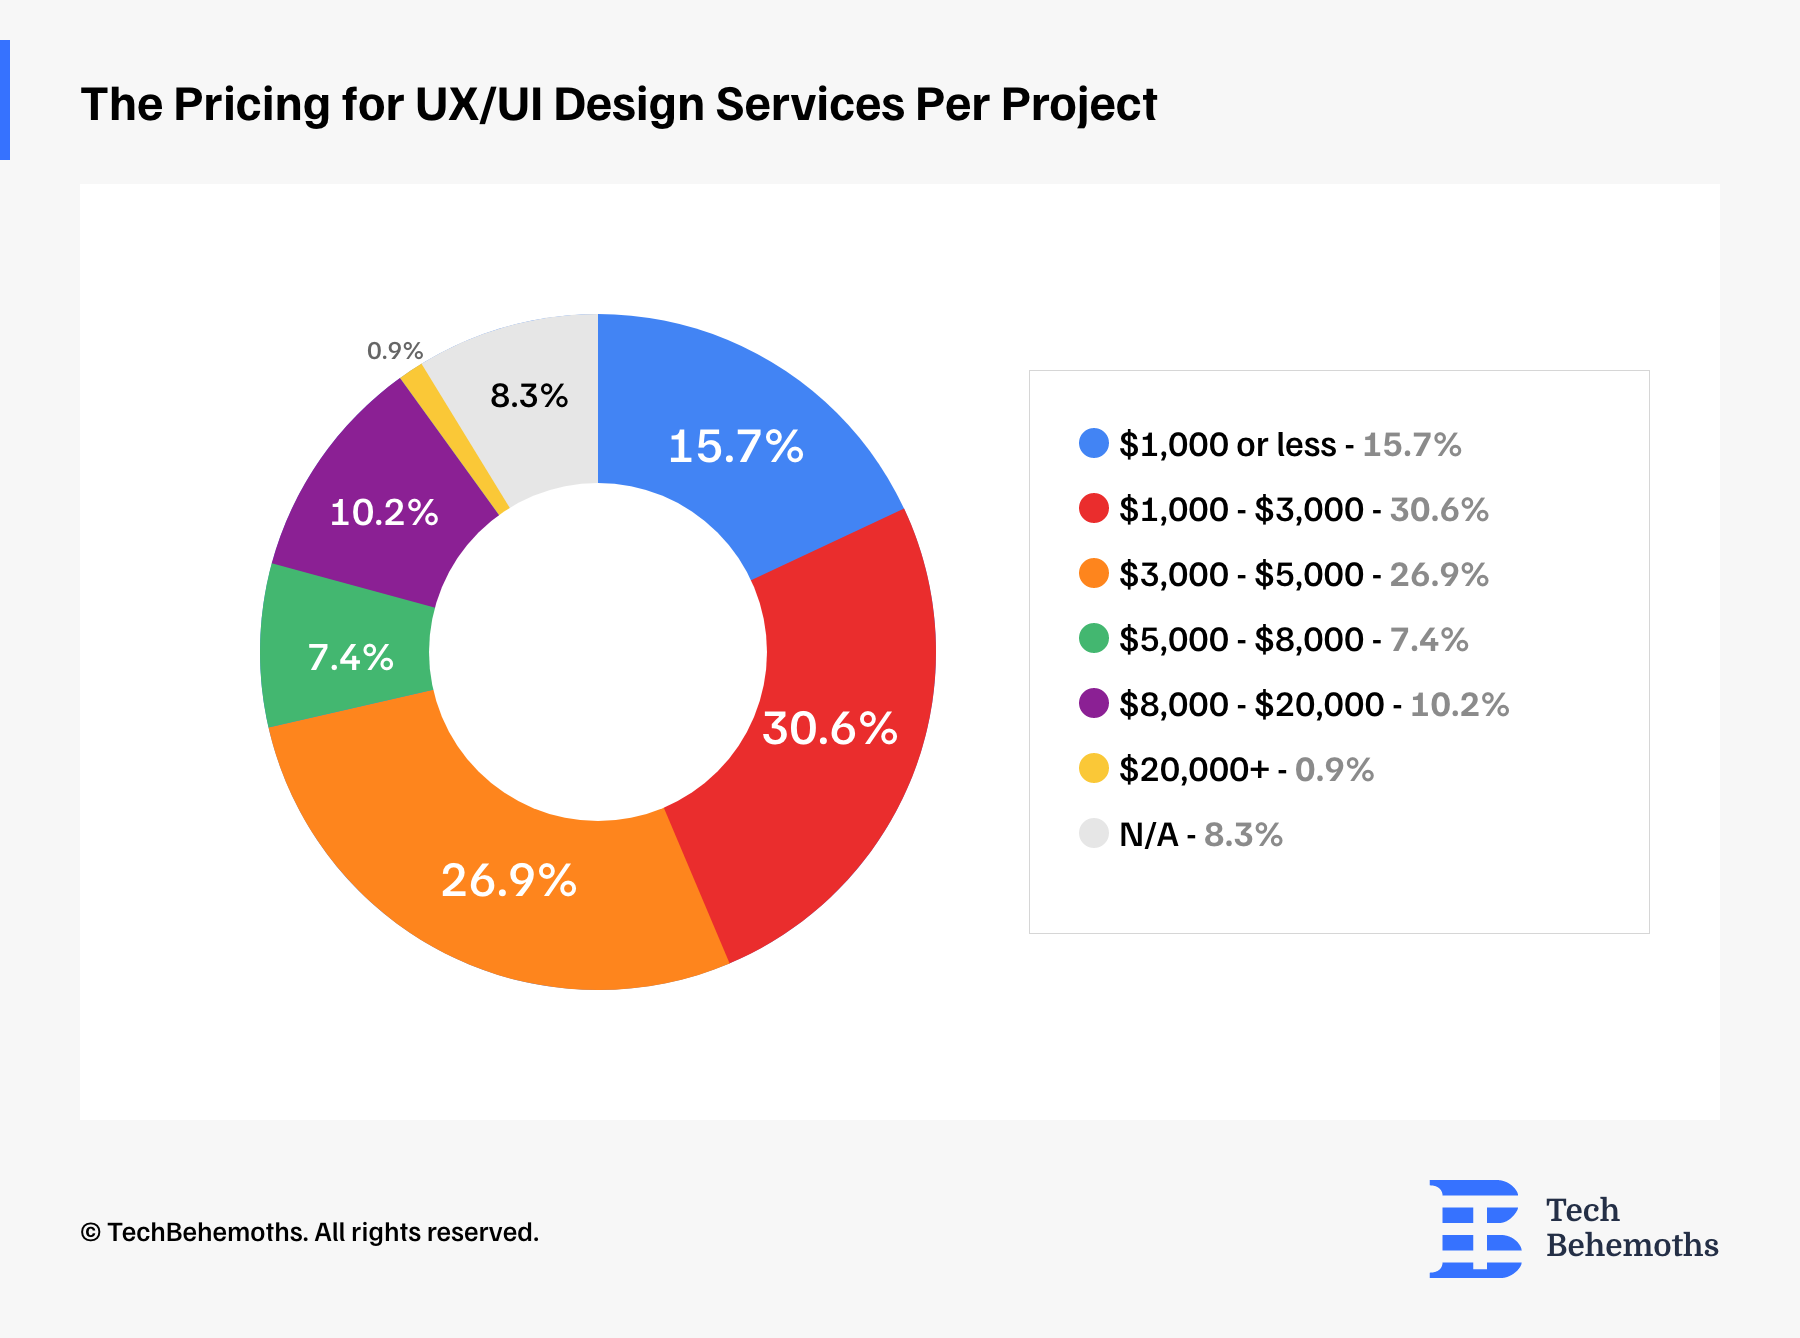
The Pricing for UX/UI Design Services Per Project
UX/UI design service costs differ among professionals, based on TechBehemoths survey data. The majority of respondents, at 30.6%, charge between $1,000 - $3,000, per project, which is a common mid-tier pricing structure. 26.9% of respondents charge between $3,000 - $5,000, which is a higher price range. 15.7% offer services for $1,000 or less, targeted to more budget-conscious clients.
A smaller portion of respondents, 7.4% and 10.2%, charge between $5,000 - $8,000 and $8,000 - $20,000, respectively. 8.3% of respondents did not disclose their pricing.
Only 0.9% charge $20,000 or more per project, which represents a premium tier of UX/UI design services.
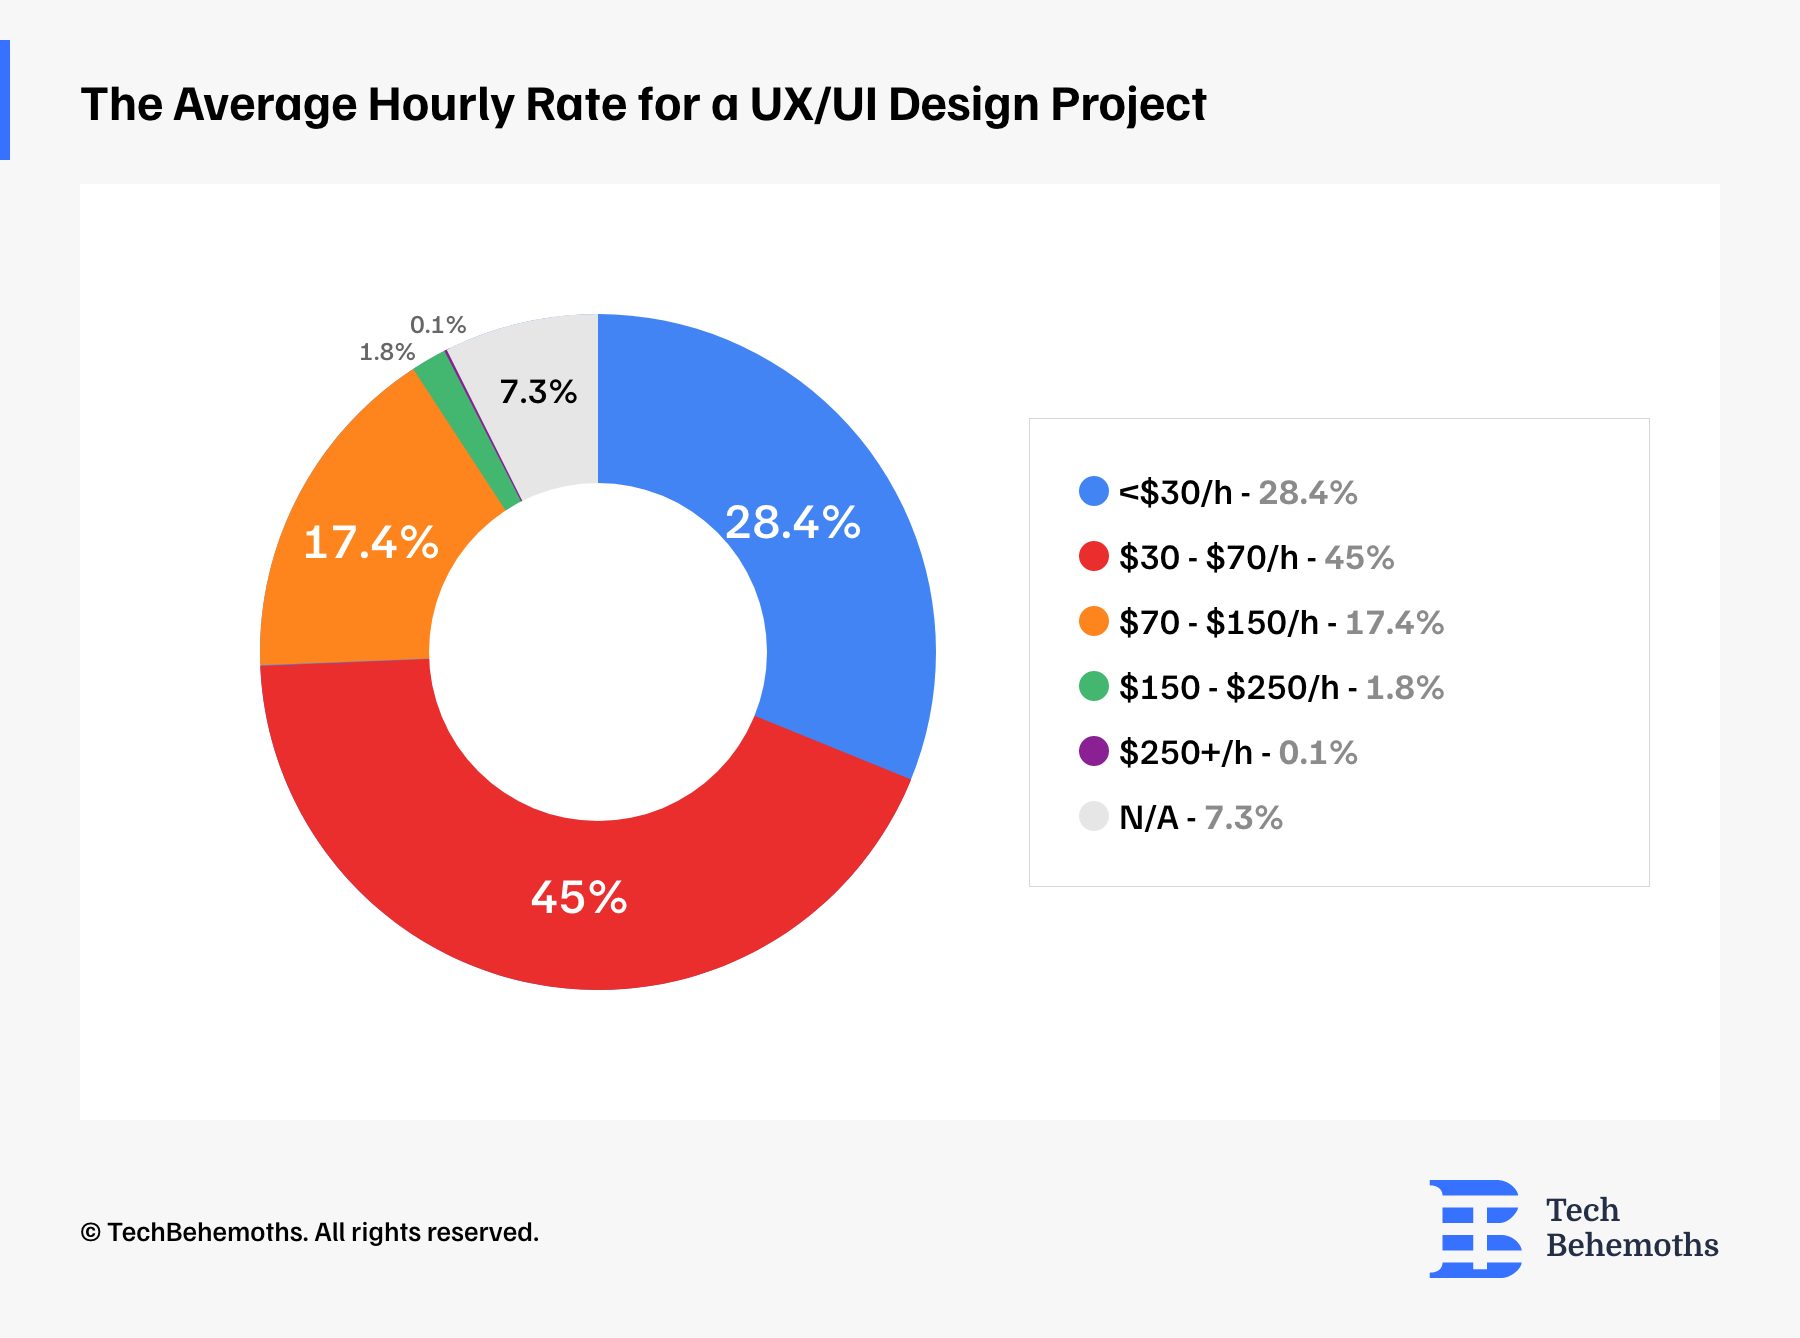
The Average Hourly Rate for a UX/UI Design Project
The survey shows that 45% of the respondents charge between $30 and $70 per hour, which is the most common price range. 28.4% charge less than $30 per hour, while 17.4% charge between $70 and $150 per hour, which is considered an average level.
Only 1.8% charge between $150 and $250 per hour, and 7.3% of respondents did not provide information about hourly rates or use other pricing structures.
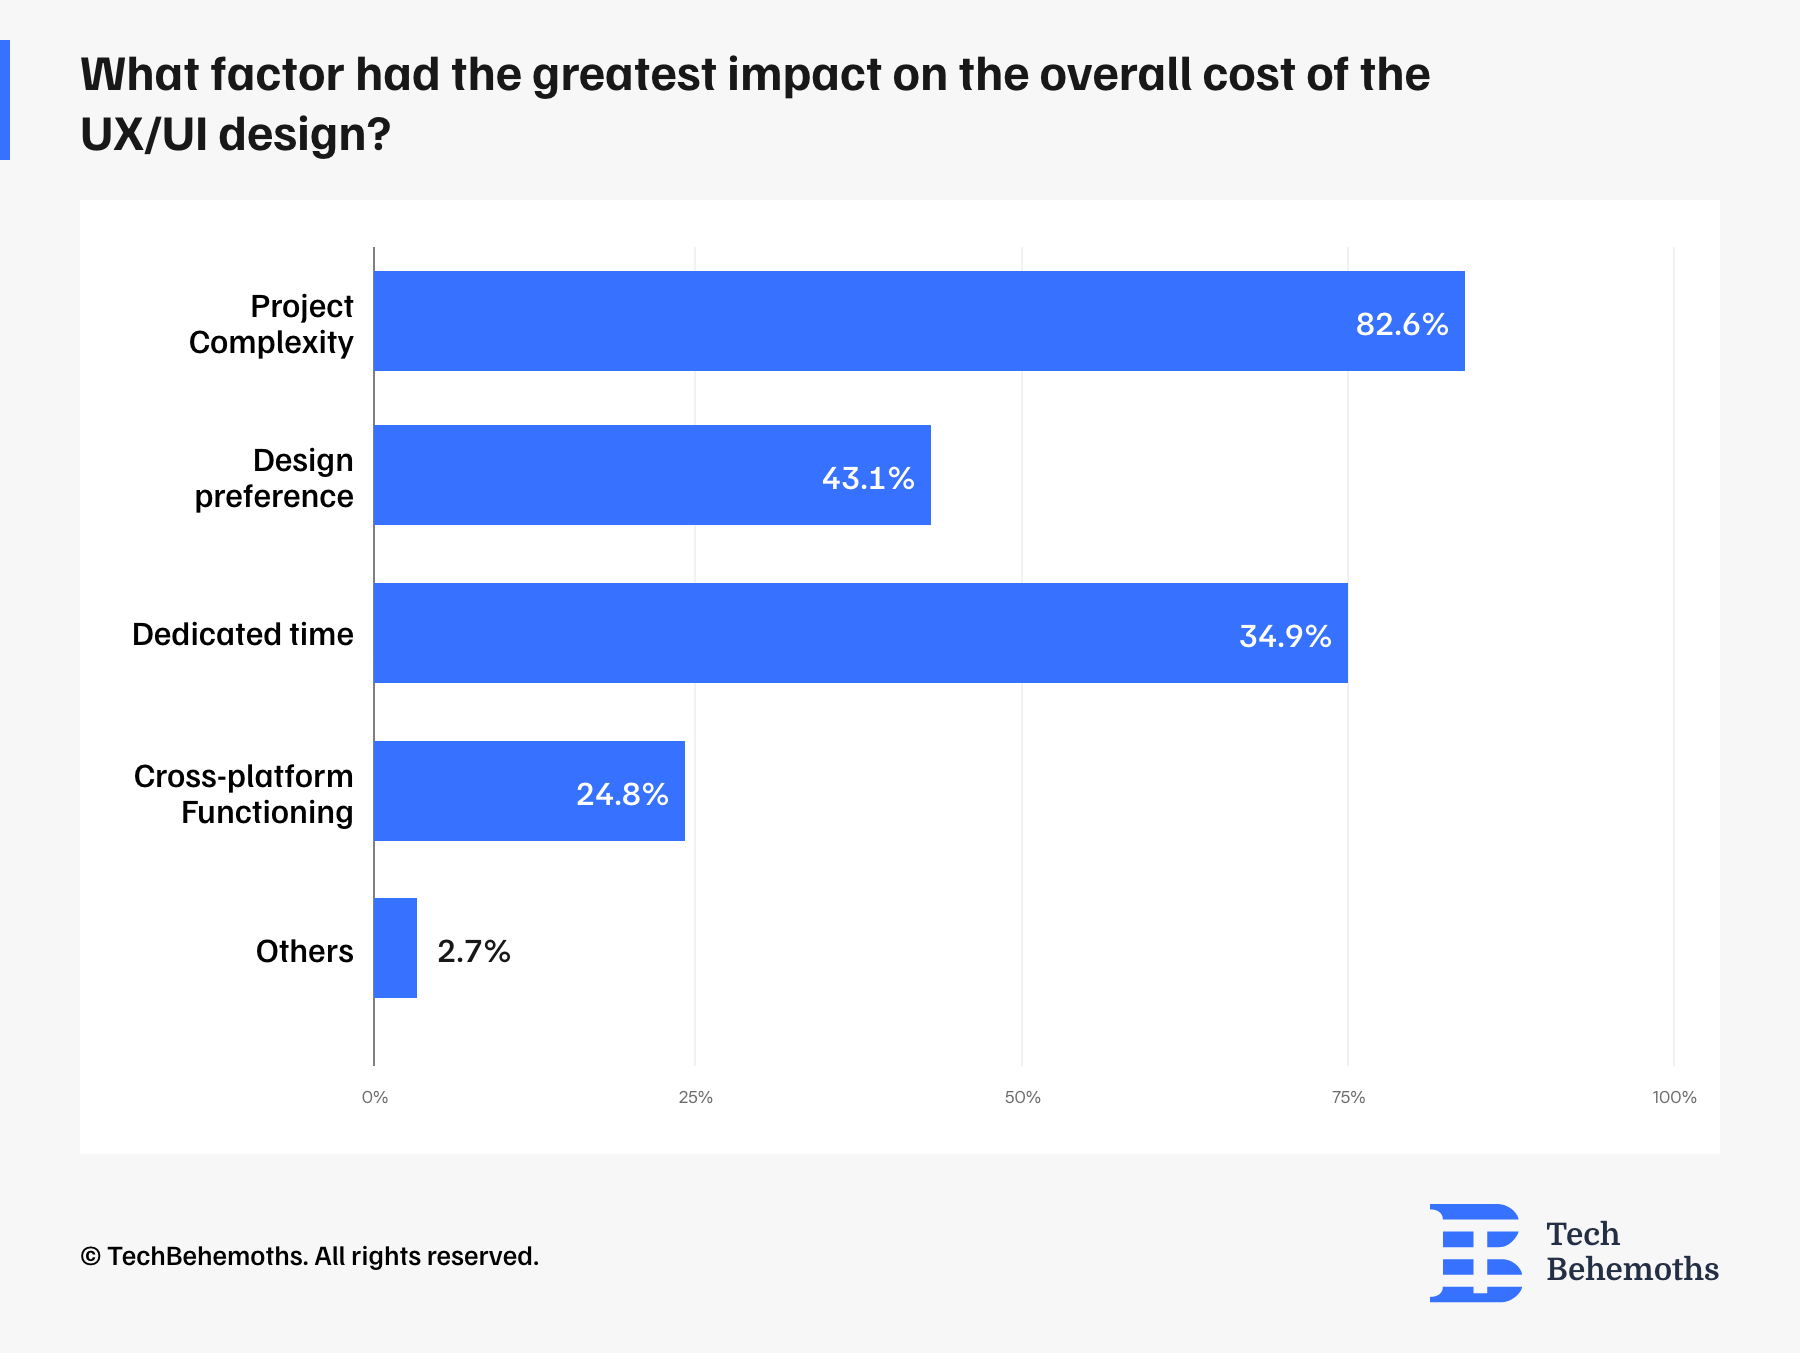
82.6% of Respondents said that Project Complexity is the most important factor affecting the overall cost of the UX/UI design
Survey respondents have identified various factors that contribute to the overall cost of UX/UI design projects.
Amongst these factors, project complexity stands out at 82.6%. This means that more complicated projects require additional resources and expertise, leading to higher costs.
Design preferences account for 43.1% of project costs, which represents client preferences and aesthetic decisions on project expenses. Another key factor is the amount of time dedicated to the project, which accounts for 34.9% of the costs. This indicates the direct correlation between the time invested in the project and its overall cost.
Cross-platform functioning is also important, identified by 24.8%, which ensures the design works well across diverse devices. The remaining 2.7% show a range of additional factors that may influence project costs.
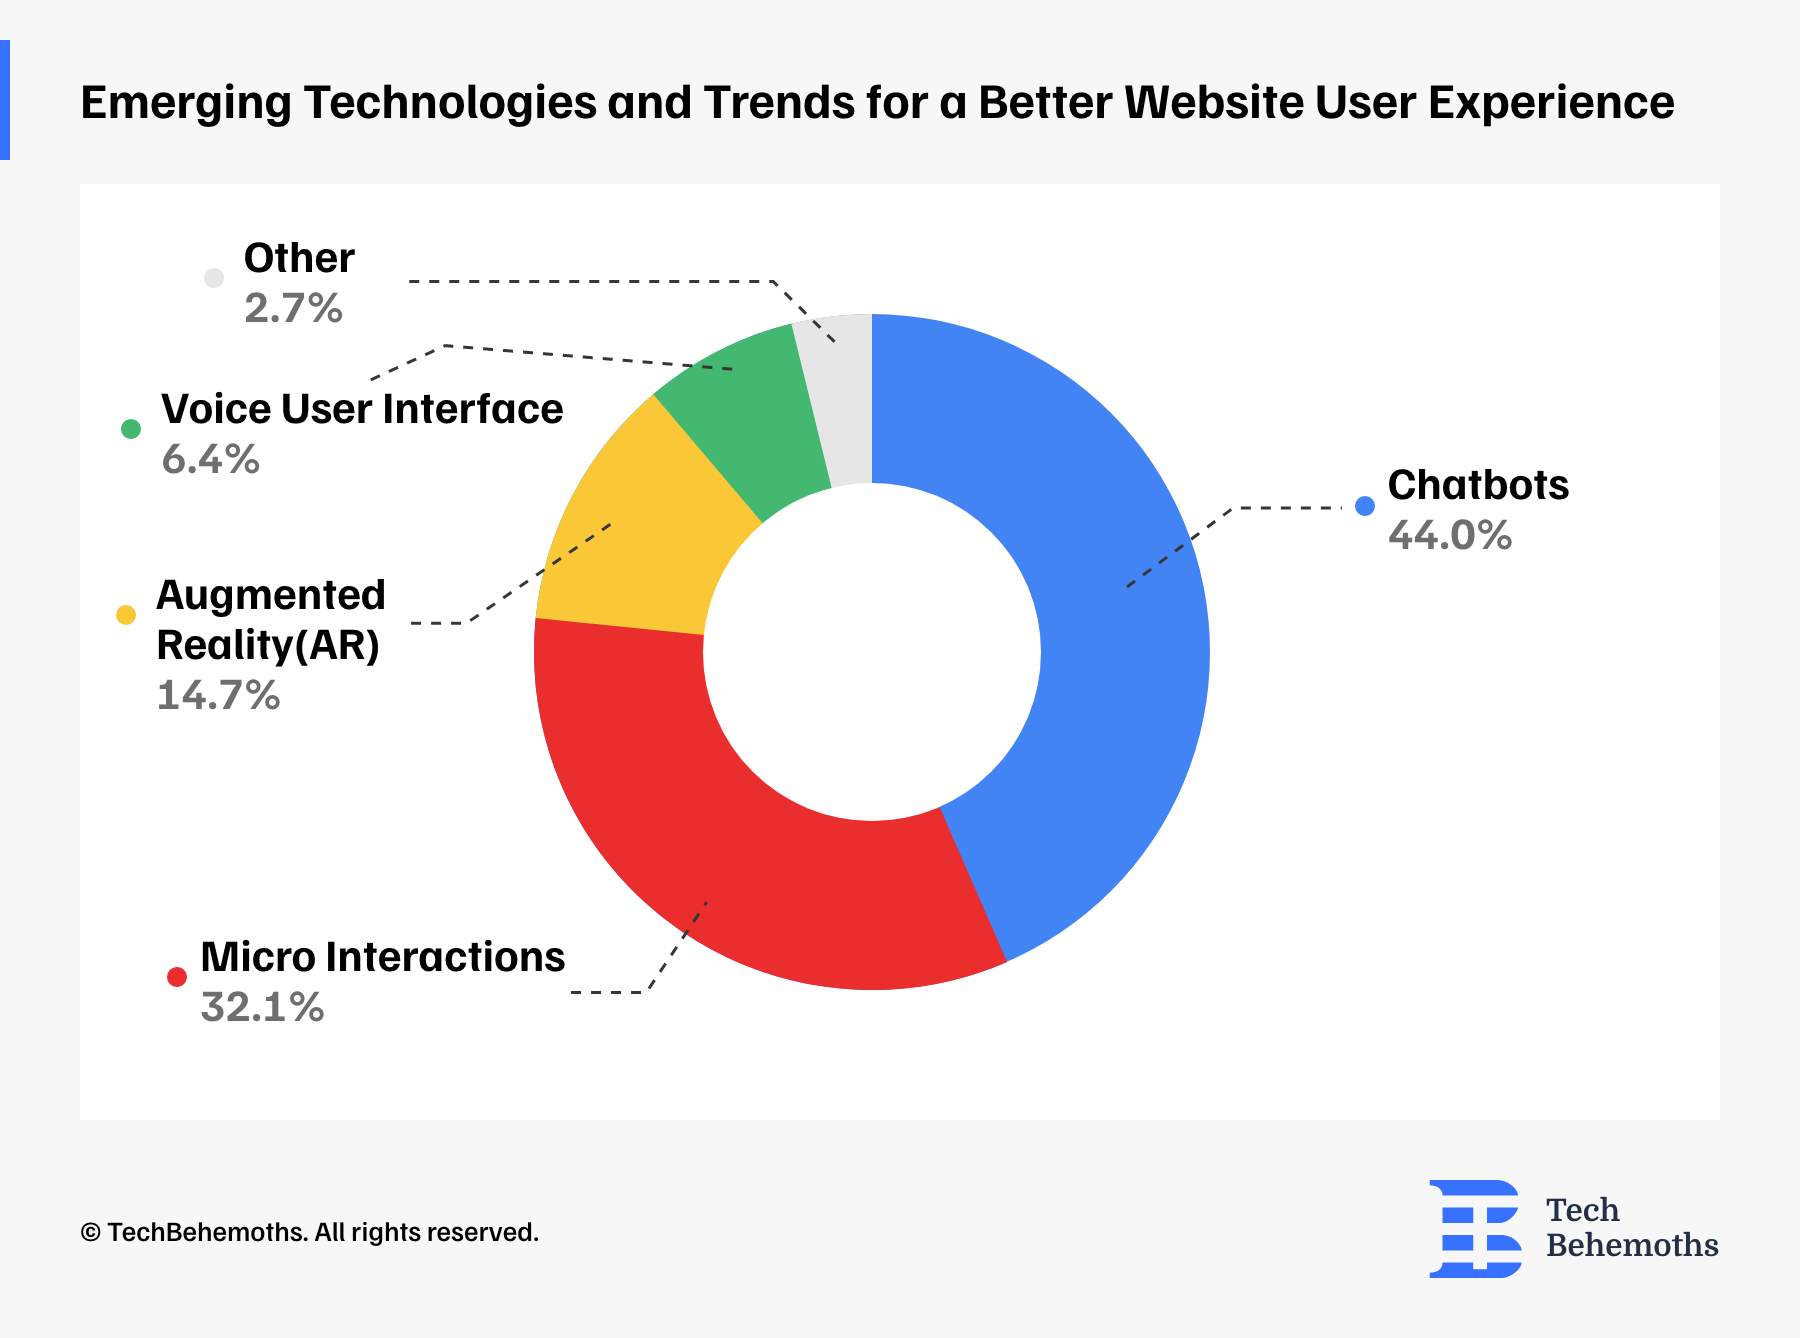
Emerging Technologies and Trends for a Better Website User Experience
Chatbots are the most popular tool and trend adopted by 44% of respondents, followed by micro-interactions at 32.1%. AR is used by 14.7% of professionals, indicating a growing interest in augmented reality technologies, while VUI is adopted by 6.4% to increase accessibility, and the rest of 2.7% suggests additional technologies or trends such as artificial intelligence.
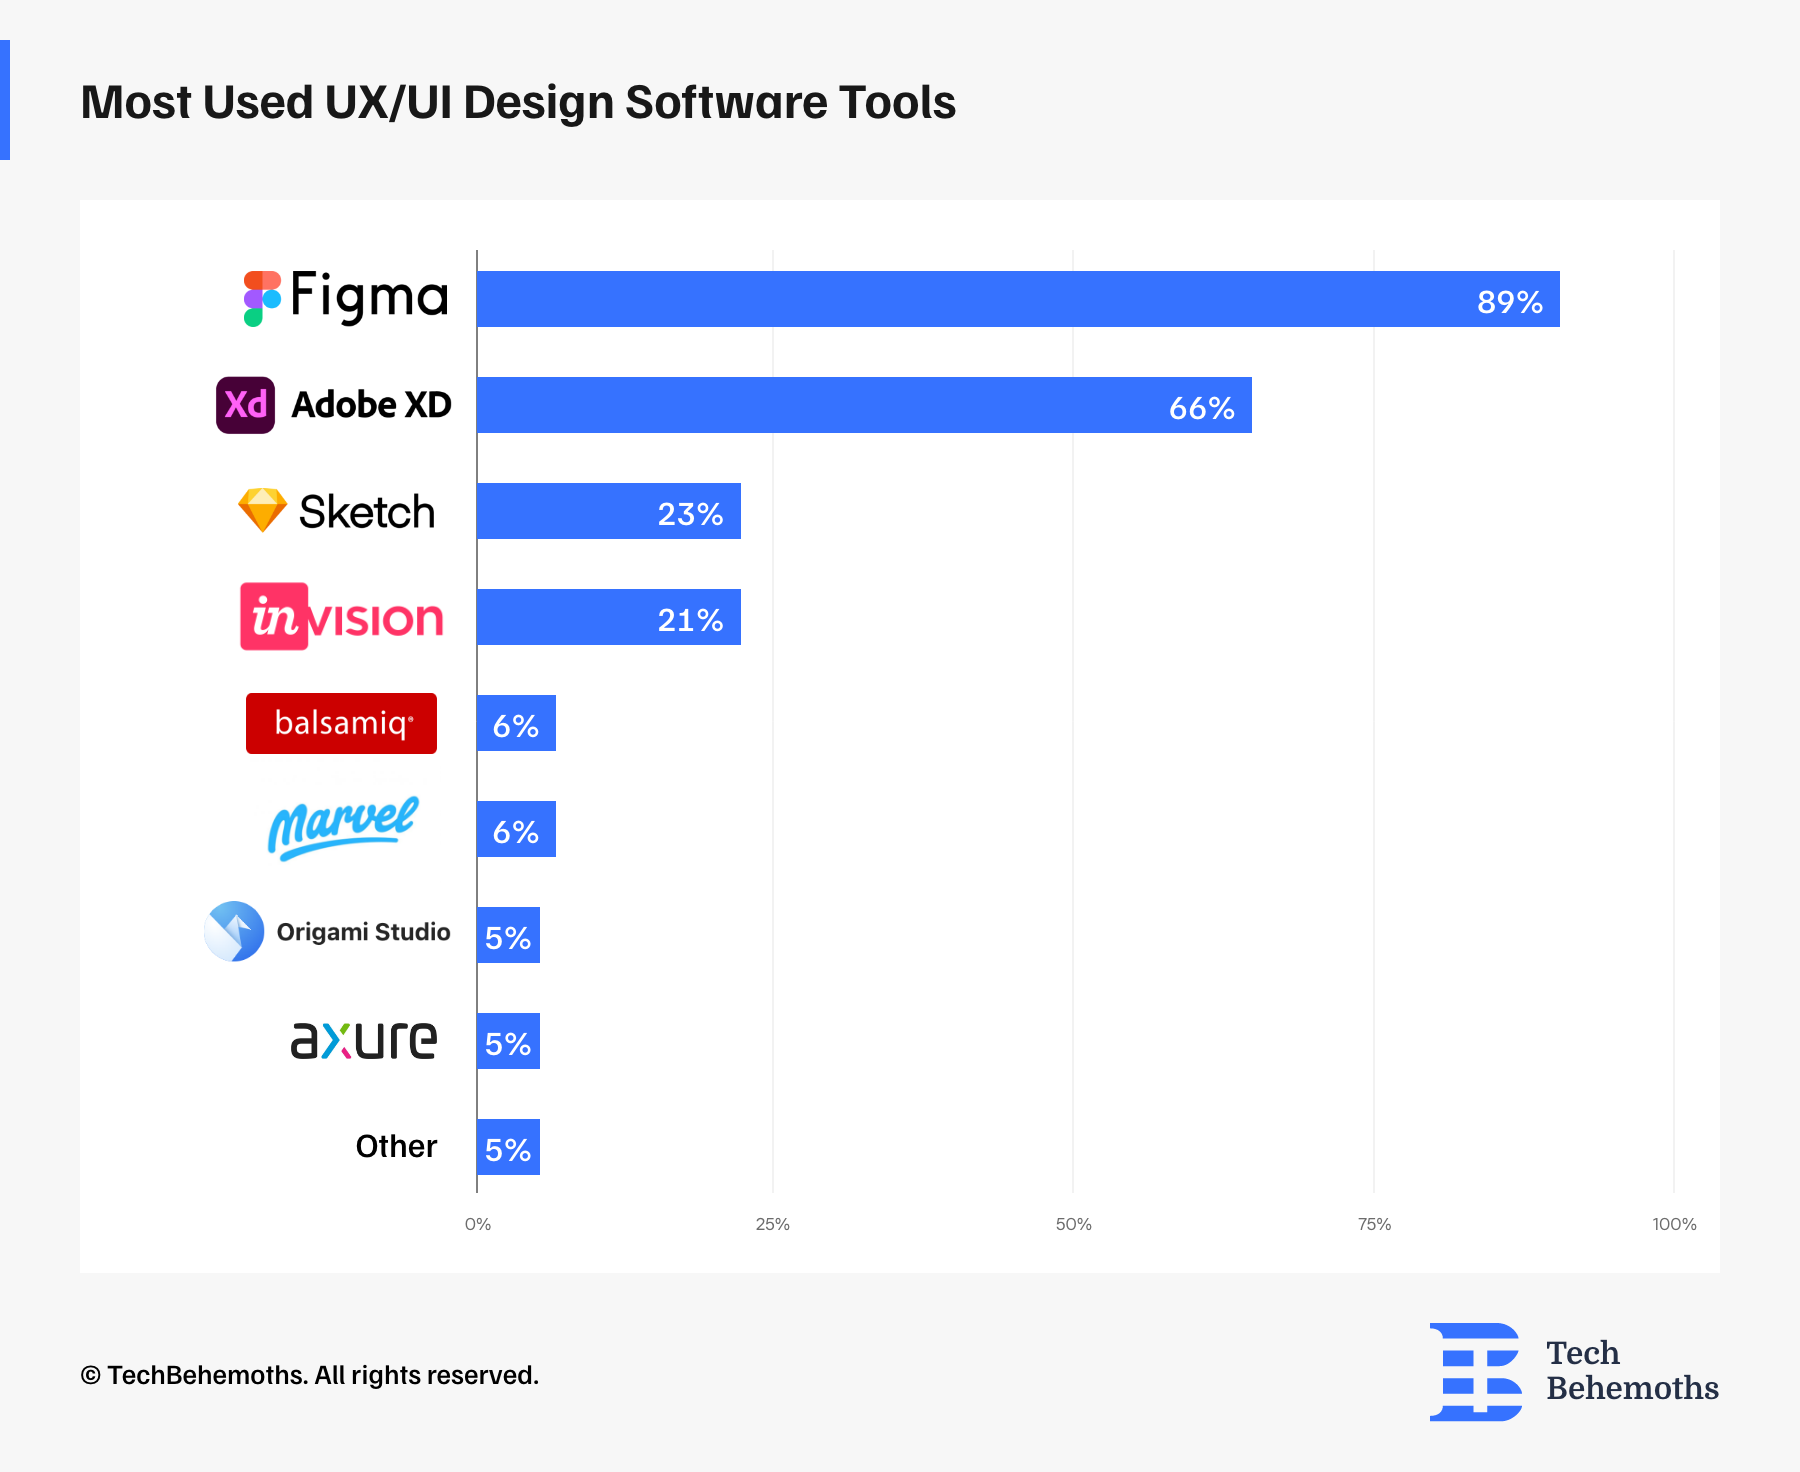
Most Used UX/UI Design Software Tools
Professionals in the field of UX/UI design use various software tools to bring their projects to life. Among these tools, Figma is the most popular, with 89% of respondents choosing it as their favorite collaborative design platform. Adobe XD is used by 66.10% of users in their work.
Sketch is used by 22.9% of professionals, while InVision is used by 21.1%. Balsamiq, Marvel, Origami Studio, and Axure are used by smaller, yet still significant, percentages ranging from 4.5% to 6.4%, showing diverse preferences for wireframing and prototyping tools.
The other 5% indicates that there are additional software choices that contribute to the varied and growing toolkit of UX/UI design professionals.
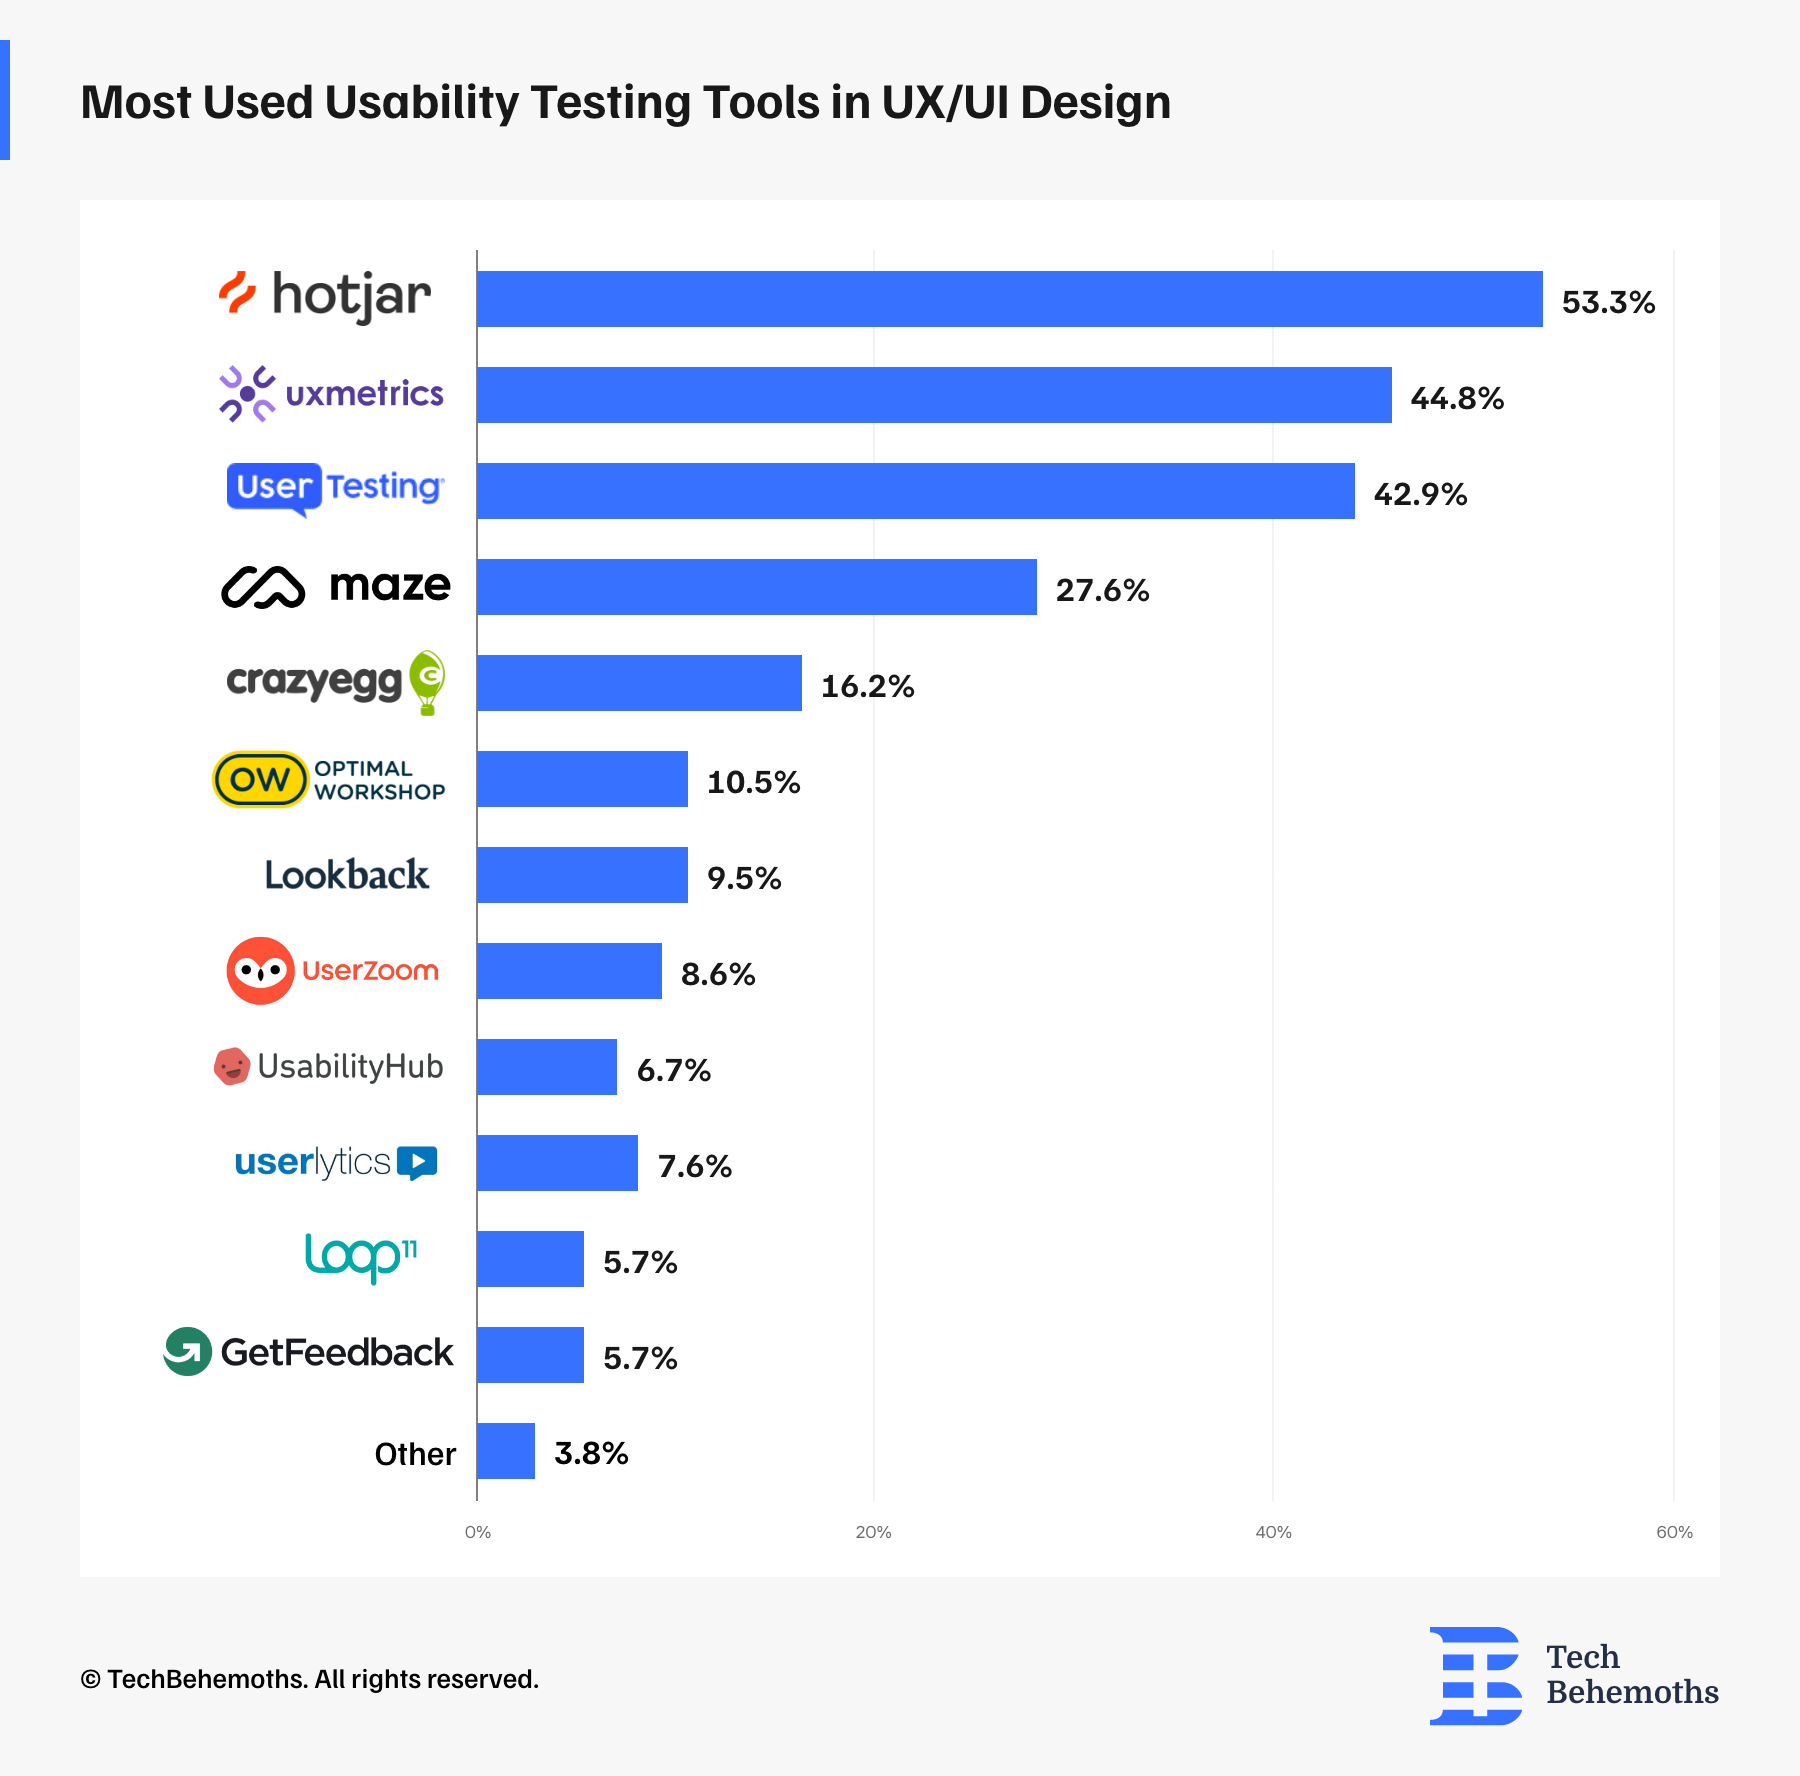
Most Used Usability Testing Tools in UX/UI Design Projects
When it comes to making websites easier to use, our survey shows that designers use a variety of tools and applications. The most popular one, Hotjar, is used by 53.3% of respondents. Hotjar provides features like heatmaps and user recordings to give a good understanding of how users interact with a website.
UX Metrics is next at 44.8%, which is a tool used for quantitative user experience analysis. 42.9% of people use UserTesting, which is a tool that draws attention to the importance of feedback from real users. Other tools such as Maze, CrazyEgg, and Optimal Workshop are tailored to specific requirements and are utilized by between 10.5% and 27.6% of the respondents.
There are also tools like Lookback, UserZoom, Lysana (UsabilityHub), Userlytics, Loop11, and GetFeedback that help to evaluate different aspects of usability. Followed by 3.8% of the other responses that suggest other less-used tools on the market.
All these tools show that UX/UI designers take a comprehensive approach to make sure their websites are effective and user-friendly.
Most Used Communication and Project Management Tools in UX/UI Design Projects
UX/UI projects can be complex and need close collaboration to stay on track and achieve goals. Because of this, effective communication each step of the way from both clients and service providers is the key to UX/UI project success. The most successful projects often involve efficient, proactive communication from beginning to end, whereas ineffective communication leads to bottlenecks and delays.
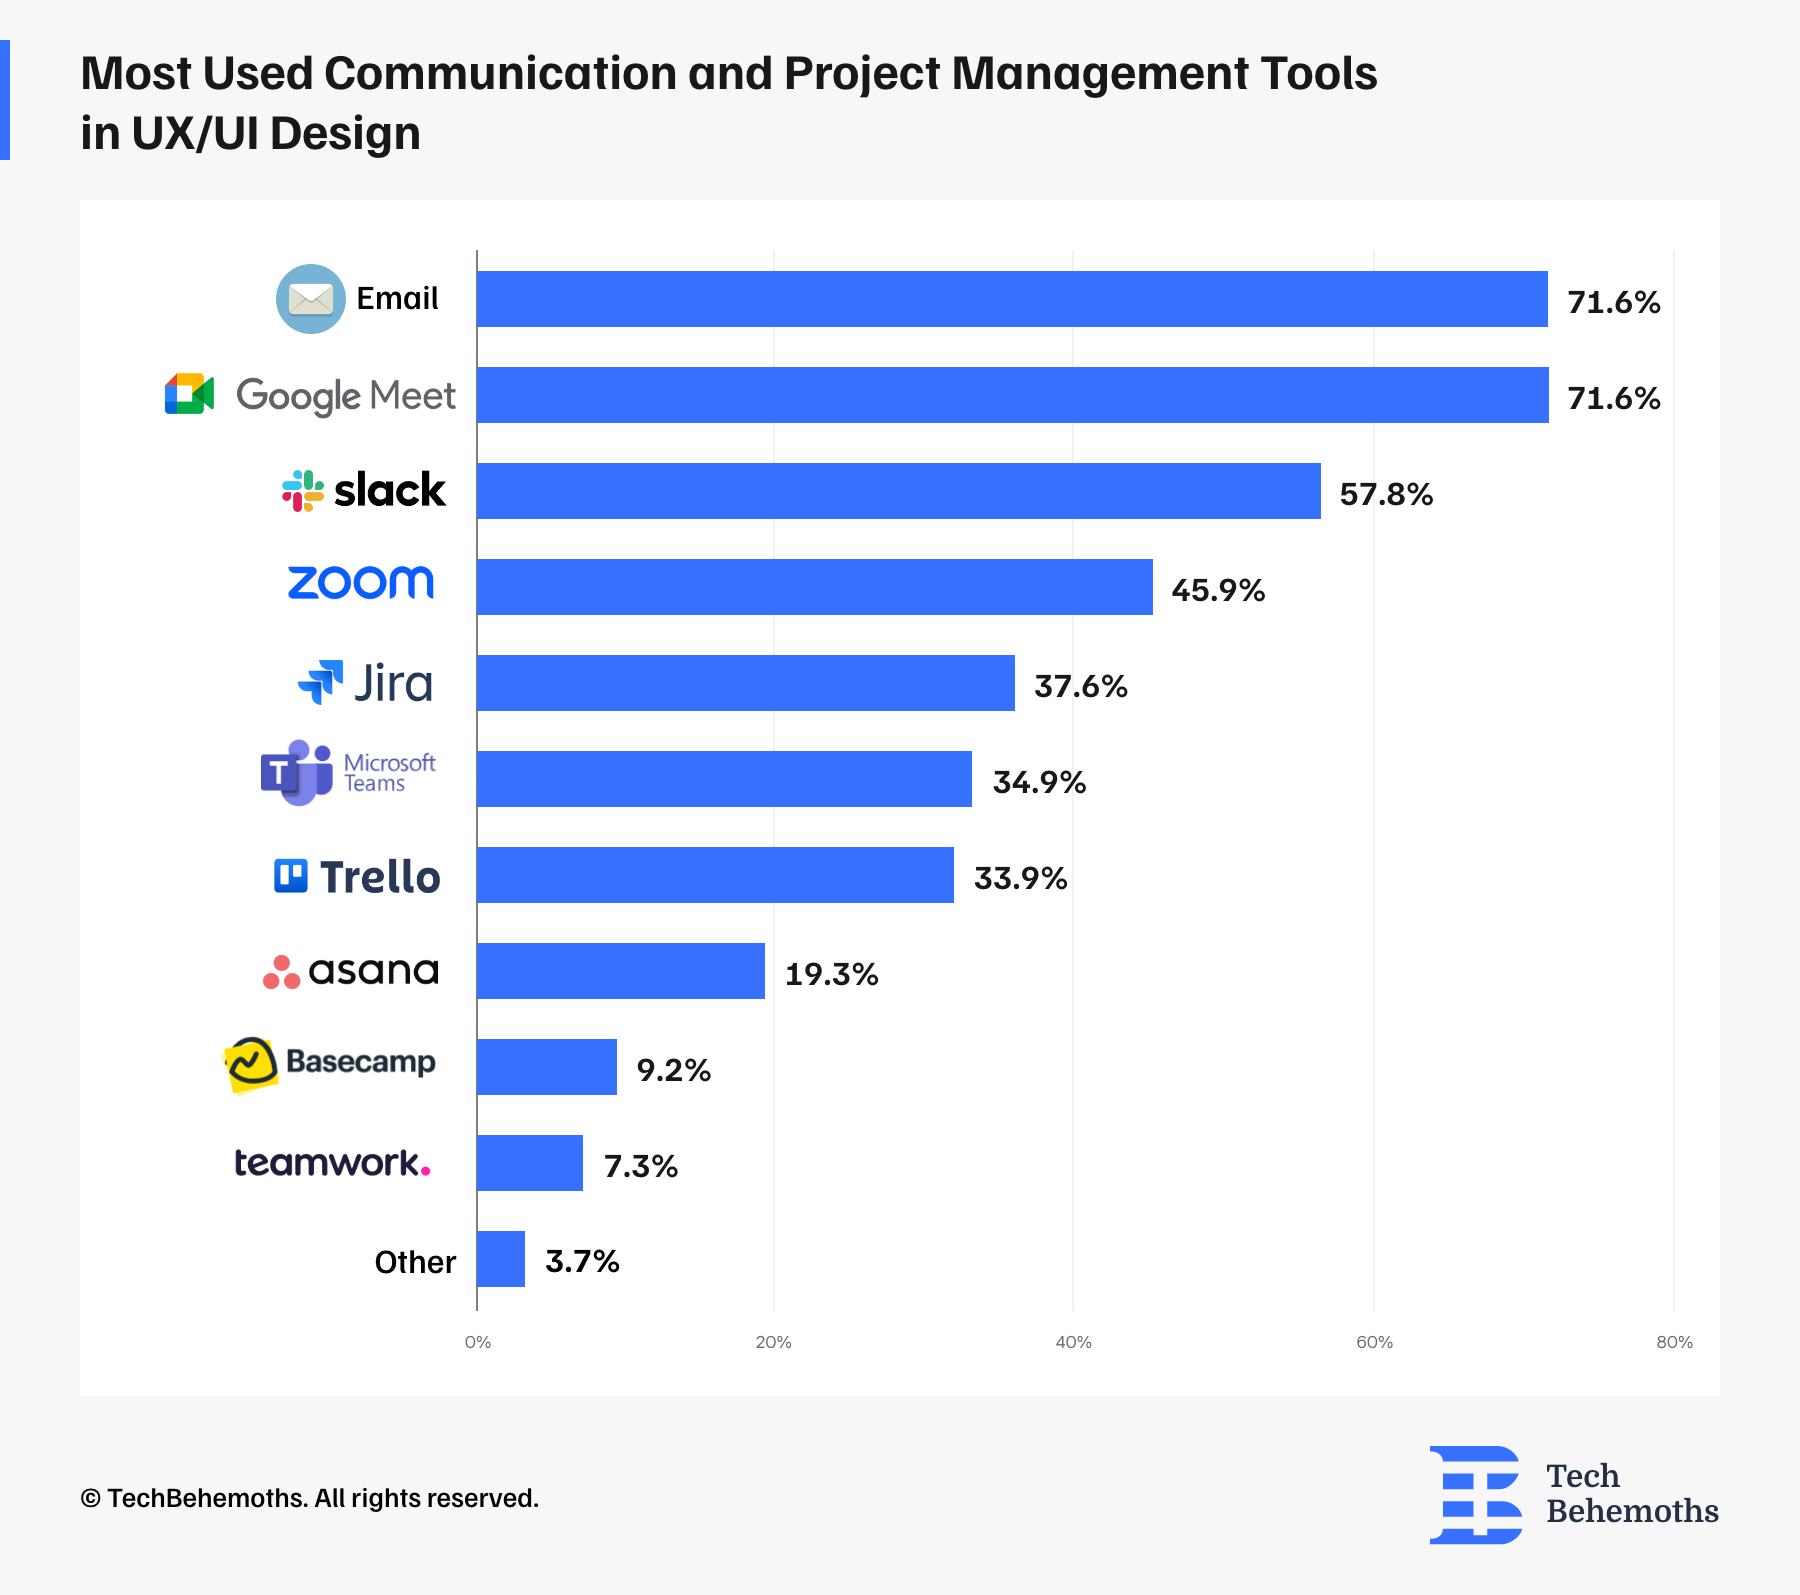
Professionals use different tools to help with these tasks. Email and Google Meet are the most popular communication tools, with 71.6% of professionals using them.
Slack is also a popular tool for real-time communication, with 58% of people using it.
Video conferencing tools like Zoom (45.9%) and project management platforms like Jira (37.6%) are also important for coordination.
Other platforms like Microsoft Teams, Trello, and Asana are used too, but with varying degrees of popularity. Basecamp and Teamwork are suited to specific needs and have lower usage rates of 9.2% and 7.3%, respectively.
Finally, 3.7% of respondents use different tools for effective communication and project management.
UX/UI Design Projects Across Diverse Industries
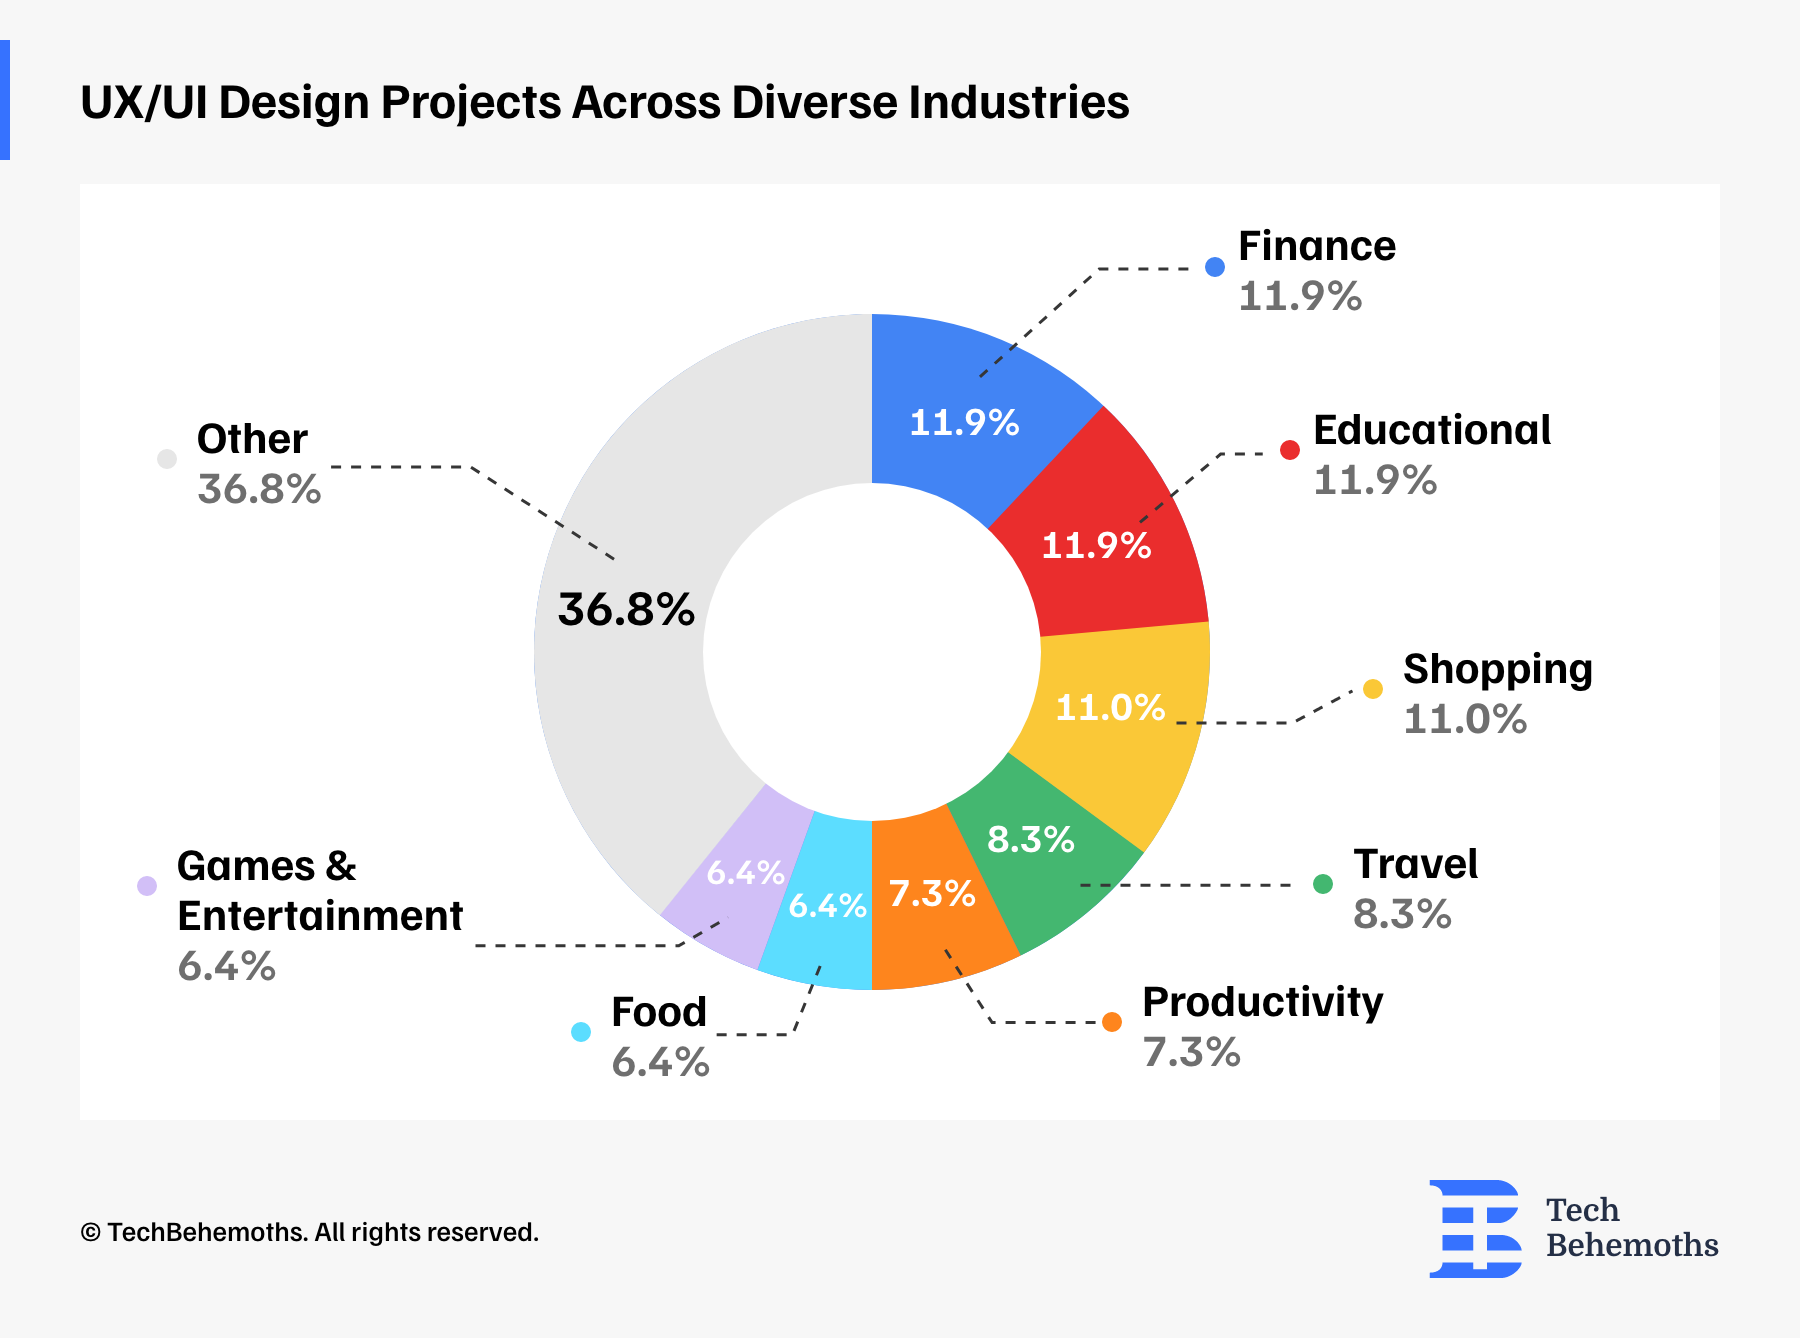
From finance to games & entertainment, education to travel, there is a wide range of industries that continue to rely on UX/UI designers to create meaningful, impactful experiences.
The data reveals that the finance industry accounts for 12% of the project, followed by the educational industry with 11.9%.
The shopping industry is the third most popular industry, accounting for 11% of the project, followed by the travel industry at 8.3%, the productivity industry at 7.3%, and the food industry at 6.4%.
The games & entertainment industry accounted for 6.4% of the project, while other industries accounted for 36.8% of the project.
UX/UI Design Projects Market Share by Region
It's interesting how the same UI/UX design pattern may affect consumers from different cultures in unexpected ways. Even in an age of internationalization, people value their customs and cultural heritage and want businesses to respect them. Professionals can adapt app and web designs to provide a natural look and feel in a certain region.
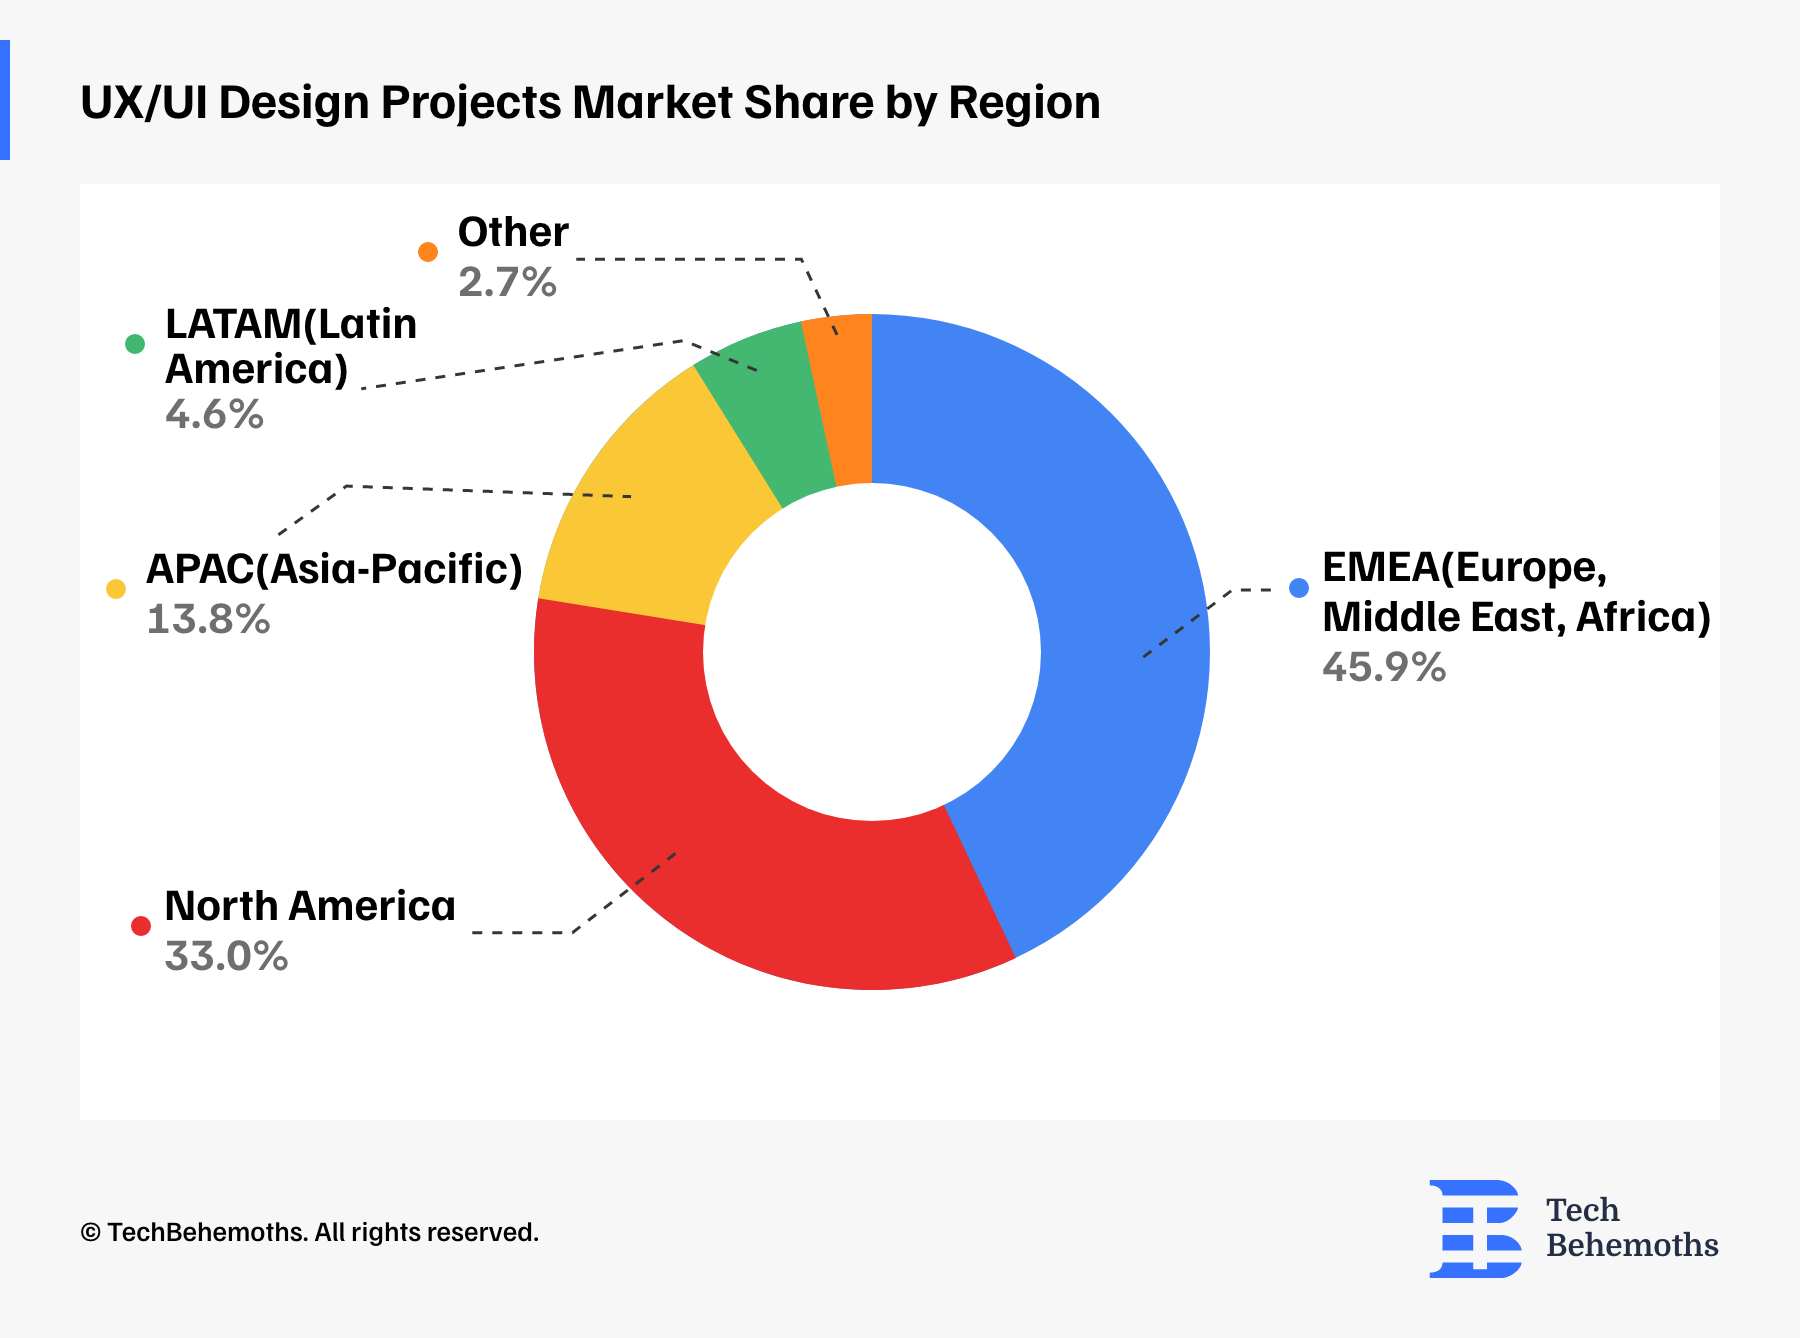
The latest UX/UI projects developed by respondents have a global focus. The EMEA region (Europe, the Middle East, and Africa) has the highest percentage of UX/UI projects at 45.9%.
While UX/UI professionals in North America (NA) have 33% of projects. The Asia-Pacific region (APAC) represents 13.8%, while Latin America (LATAM) contributes 4.6%. The remaining 2.7% of projects target other markets or regions.
Survey Conclusions and Key Points
-
UX/UI design companies suggest that project durations beyond the specified options depend on project requirements and complexity.
-
76.1% of UX/UI companies design new websites/apps and work on existing ones.
-
Figma is the most often used UX/UI design tool among UX/UI companies, followed by Adobe XD.
-
87% of companies prioritize responsiveness across devices, visual design, and navigation.
-
Hotjar is the most popular usability testing tool in UX/UI Design, followed by UserMetrics and UserTesting.
-
The biggest challenges for companies are usually a lack of time and budget.
-
Chatbots are the most popular tool and trend adopted by companies, followed by micro-interactions.
-
Feedback surveys are the most reliable measure of success for UX/UI design improvements.
-
Conversion rate optimization (CRO) is the most important success measure.
Partner Companies
The survey was not limited to any geographical region or country and its main target was the global community of IT companies and web agencies. As such, survey respondents totalize the number 1570 specialists from 1062 companies, located in 48 countries across the globe. On this occasion, TechBehemoths is proudly announcing and crediting the list of partner companies that helped spread the word and gather answers for this survey.
-
MEIRA PRODUCTIVITY S.A., Argentina
-
https://bigredes.com/, Argentina
-
3Focos, Argentina
-
Milies, Armenia
-
Futuretheory, Australia
-
Lamp Techs, Bangladesh
-
Xceed Bangladesh Ltd., Bangladesh
-
Zovo Team Ltd., Bangladesh
-
ExpandX, Bulgaria
-
Fram Creative, Bulgaria
-
Mäd, Cambodia
-
Activerify, Cambodia
-
Build Me App Inc., Canada
-
Tekki Web Solutions Inc., Canada
-
Notch, Croatia
-
Optimize Curacao, Curaçao
-
GOOiZ, Cyprus
-
Katión Interactive, Dominican Republic
-
Aun Digital, Dubai
-
CreativesCastle, Egypt
-
Perpetio, Estonia
-
Mobiteam, Germany
-
UHP, Germany
-
Bogdanovic, Germany
-
CANDEE, Greece
-
Creative Studio, Greece
-
Itcatmedia, Hong Kong
-
Minds Task Technologies, India
-
Cognegiac Solutions Pvt Ltd, India
-
Piexxi Technology LLP, India
-
LitSpark Solutions, India
-
Ortus Knights, India
-
Nowgray IT Services Pvt Ltd, India
-
Information Technology, India
-
Our Business Ladder, India
-
Navtech, India
-
Kinsh Technologies, India
-
Excelsior Technologies, India
-
Techuz, India
-
Explosify Creative Solutions, Kenya
-
Solveita, Malta
-
Axented, Mexico
-
WebHived Agency, Morocco
-
Chaitanya Design, Nepal
-
Neobot Tech, Nigeria
-
Clikconsult, Nigeria
-
Eagle IT Solutions, Macedonia
-
INFINITY-UP, Pakistan
-
ExoBinary, Pakistan
-
Devbion, Pakistan
-
Maven Media Group, Pakistan
-
women technology house, Pakistan
-
Jerrax, Pakistan
-
Chromadesignhub, Pakistan
-
MAKSOL DIGITAL SOLUTIONS, Pakistan
-
ThinkBIT Solutions, Philippines
-
ThinkBIT Solutions Phils, Inc., Philippines
-
Inuits Sp. z o.o., Poland
-
Mobile Reality, Poland
-
design studio, Poland
-
Cherryvue, Poland
-
Inuits, Poland
-
Twistag, Portugal
-
Neev Technologies, Portugal
-
Webamboos, Romania
-
Mobiteam GmbH, Romania
-
OCTAGRAM, Romania
-
Venum Agency, Romania
-
IPCS, Saudi Arabia
-
Project023 DJVD, Serbia
-
Digital Creators Network, Serbia
-
GrownApps s.r.o., Slovakia
-
Sudolabs, Slovakia
-
Neslo Tech, South Africa
-
Via Kasi Digitals, South Africa
-
Blaze Media, South Africa
-
Akkenum Interactive, Sri Lanka
-
5w155 SA, Switzerland
-
GHC GmbH, Switzerland
-
B-Wire, Syria
-
Risetech Company, Tanzania
-
AJAI Studio, Thailand
-
BRAVA 360 Digital, UAE
-
isazeni solutions SMC, Uganda
-
Marketing agency, United Kingdom
-
Sixtwo Agency, United Kingdom
-
Teplin Agency, Ukraine
-
Riaz, United Kingdom
-
InStandart, United Kingdom
-
Blue Bee Web Inc., United States
-
Fleekbiz, United States
-
Prime Web Design, United States
-
Rockit Development Studio, United States
-
CCS Interactive, United States
-
DNA Digital Marketing, United States
-
AppWT LLC, United States
-
Geeks for Growth, United States
-
Kesewi, United States
-
Kellton Tech Solutions, United States
-
CCS Interactive, United States
-
Vuemobi Media, United States
-
Holicky Corporation, United States
-
Twofold Marketing, United States
-
2N Consulting Group, United States
-
Solvd inc., United States
- iContact Africa Solutions, Zimbabwe
Creativity has always been at the heart of who I am, from my love of art to my passion for writing. As a professional, my mission is to inform, inspire, and persuade, helping brands form deeper connections with their audiences. For me, talent is only 1% of success – the rest comes from dedication, strategy, and continuous learning.
Discover more TechBehemoths Insights
Learn practical tips and insights about IT Companies, how to find the right company for your projects.
Read the latest news about Market Trends and fresh Interviews.