5 Product Performance Metrics Every Startup Should Track


Imagine that you are driving a car. You have a dashboard in front of your eyes where the car's speed, engine speed, gasoline level are shown, and many other indicators will light up if something goes wrong.
What is shown on the dashboard in the car is a set of metrics that turned out to be the most important and, at the same time, sufficient for you to assess the situation at any time and, if necessary, influence it. Startups, or actually all businesses, need such a dashboard too.
At first glance, it seems like an easy task to come up with a system of such metrics, but in reality, you need a way more than a simple understanding of a set of random numbers. On the contrary, it should be a thoughtful dashboard with a minimum number of indicators. Still, at the same time, based on the information provided, you can unambiguously answer most of the key business questions.
So, what are the most important product performance metrics to track?
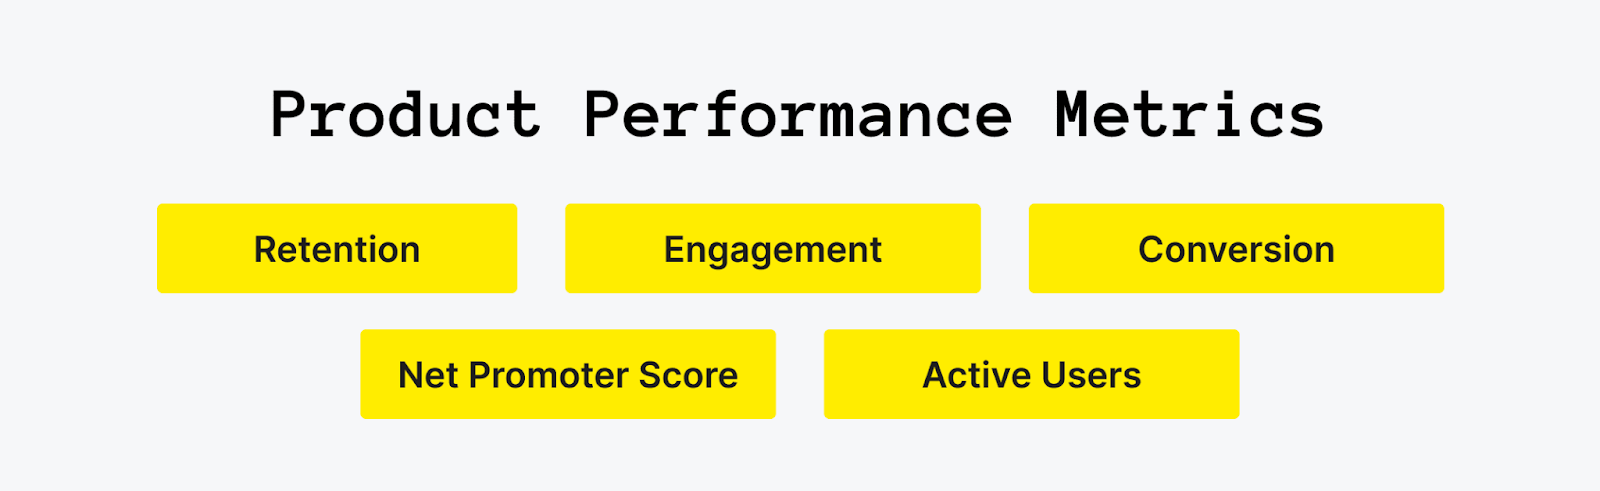
5 Product Metrics to Track
Undoubtedly, there are different types of businesses and industries they serve, but the list we provide here is comprehensive enough to cover the most commonly used metrics and provide a great product experience. Based on it, you can decide what to track and what doesn’t match your business. Without further delay, let’s get the ball rolling.
Retention
Retention (Retention rate, RR) is one of the key metrics for any product. Retention means "user retention" or "user returnability." It tells you whether people continue to use your product over and over again, whether they find enough value in it to solve their tasks. Simply, it answers how many people returned on day X (week X, month X) after the first entry into the product.
Why does retention matter? If users regularly use the product and retention stays practically the same during different time periods, you have a steady plateau. It means that your product has a big audience that continuously grows, and you no longer need to worry about how to find a product-market fit.
How can you calculate retention?
To calculate retention, you need to know the dynamics of the number of active users of a certain cohort by days (or weeks or months). For example:
-
Take the number of new users on Day 0 (the day when the user group arrived);
-
Take the number of active users per Day N (the day you are interested in calculating the Retention metric);
-
Divide the second value by the first, and multiply the result by 100.
And we have the formula:
Day N retention = (Number of users on Day N / Number of users on day 0) x 100

Engagement
Engagement shows how deeply and actively users interact with your product. Engagement is a set of metrics, not just one metric, because many indicators can serve as signs of customer engagement.
You can observe interactions by tracking how much time users spend on a page (session duration), how many users bounce (visited one page and left), how many pages they visited, active trials, and more.
How can you calculate engagement?
Engagement = (The chosen interaction data / The number of users you have during a certain time period) x 100

Conversion
A conversion is a transition from one stage to another. It shows how many users took a desired action. Usually, the most important conversion is from a session to a purchase or subscription. It can also be the percentage of people who've signed up for a free trial, subscribed to a newsletter, or downloaded a white paper.
Businesses optimize their sales funnel to boost conversion because it helps to transit your prospect or lead into a paying customer.
Active Users
Active users are unique users who interact with an application or website for a certain period of time, and represent a metric designed to measure growth, churn and loyalty to a product.
This metric is usually calculated according to different time frames. DAU (Daily Active Users), MAU (Monthly Active Users), WAU (Weekly Active Users) are the most popular ones.
You can track all three metrics at once, just each will reflect its own aspect of user behavior. For example, DAU will show an instant reaction of people to the launch of an ads campaign — if the numbers are growing rapidly, then advertising is effective. While the MAU and WAU metrics speak more about the stability of demand for the application.
NPS
Net Promoter Score (NPS) shows long-term user satisfaction and the percentage of your loyal clients. The calculation of NPS is based on the responses of users on a scale with scores to the question, "Are you ready to recommend the company/product to friends?". This product performance metric is especially great when you want to understand users’ actions, their loyalty, and engagement.
How does the NPS scale work? Clients rate your product/company from 1 to 10 based on how satisfied they are with it. Based on their answers, they can be divided into two groups: promoters (who rank your product with a 9 or 10) and detractors (who rate it from 0 to 6). Those who gave you a 7 or 8 have a neutral opinion.
How can you calculate NPS?
NPS = The percent of promoters - The percent of detractors

Summing up
Objectively, monitoring product performance metrics isn't the only answer to achieving business success. They are just helpers that reflect the state of your product and give you a hint on what actions to take and how to improve users’ satisfaction. And you are the one who drives a car to success.
One more important point here that must be remembered is that you need to not only just track metrics but also implement changes based on their tendencies. Monitoring indicators over time requires rigor, discipline, and concentration. Analytics tools such as Mixpanel, Google Analytics, and Amplitude can help with it. Improving metrics requires all of the above plus ingenuity. This is exactly what product development is all about.
Are other product performance metrics important for startups to succeed?
Elizabeth is a senior content creator at Upsilon and is passionate about reading and writing. She is interested in technologies and the untapped potential they carry for the digital transformation of businesses.
Discover more TechBehemoths Insights
Learn practical tips and insights about IT Companies, how to find the right company for your projects.
Read the latest news about Market Trends and fresh Interviews.