Crypto Trading Fundamentals - First 5 Things You Should Pay Attention To


The hottest topic at any birthday party nowadays is cryptocurrency. If you have not heard of cryptocurrency by some miracle, here is a small explanation. Cryptocurrency is any form of currency that exists digital or virtual, which is decentralised; meaning no central authority regulates them. Internet availability facilitates the process of crypto trading and makes it attainable for everyone. However, profitability is not so common for everyone. Besides the most popular cryptocurrencies you already heard of, there are some that follow a cause. A reputable example of this kind is Shiba's Wife - a new project that donates 10% of transaction fees to women with violated rights.
Since crypto trading is so accessible, there is a solid majority of actors on the market who perform trading transactions without prior knowledge or research. Technical analysis and creating a trading plan are key to at least making a chance of becoming profitable. Therefore, here are 5 tips to help you on the road to becoming a profitable trader.
#1 Understand the Support and Resistance Attributes
Support and resistance are the most discussed attributes of technical analysis. These terms are used by traders to refer to price levels on charts that could act as barriers. This could potentially prevent the price of an asset from getting pushed further. But what is support and what is resistance?
-
Support: Support is where a downtrend is expected to pause due to the high demand at that price level. As the price drops, demand for the shares increases. The lower it goes, the higher the demand, thus forming a support line.
-
Resistance: Resistance is where an uptrend is expected to pause due to the high supply at that price level. Like support, based on price fluctuations supply changes as well. The higher the price, the higher the supply. This forms resistance.
The more times one of these levels is tested, the more important they get. More buyers and sellers will notice and trade these levels when prices keep bouncing off support or resistance.
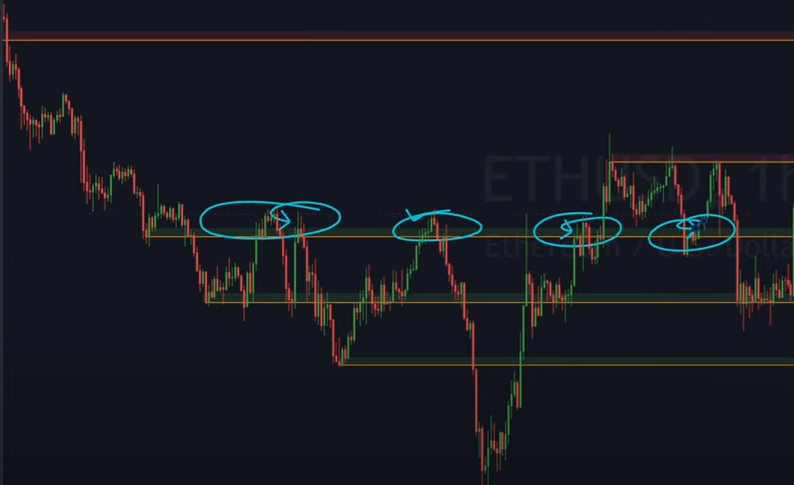
As can be seen below, the first three circles show resistance. However, as can be seen in the fourth circle, resistance can flip into support. It is important to note that either two things can happen at these levels. It can either bounce off these levels or go straight through it resulting in a big price change.
#2 Fibonacci retracement Analysis Methodology
Fibonacci retracement is a technical analysis method to determine potential support and resistance levels. It is named after the Fibonacci sequence of numbers whose ratios show price levels. At these price levels, the market tends to retrace a portion of a move.
The Fibonacci sequence is as follows:
0, 1, 1, 2, 3, 5, 8, 13, 21, 34, 55, 89, 144, 233, 377, 610, etc
Notice the following:
-
233 = 144 + 89
-
144 = 89 + 55
-
89 = 55 +34
Dividing one number by the next number yields 0.618, or 61.8%. Divide a number by the second number to its right, and the result is 0.382 or 38.2%.
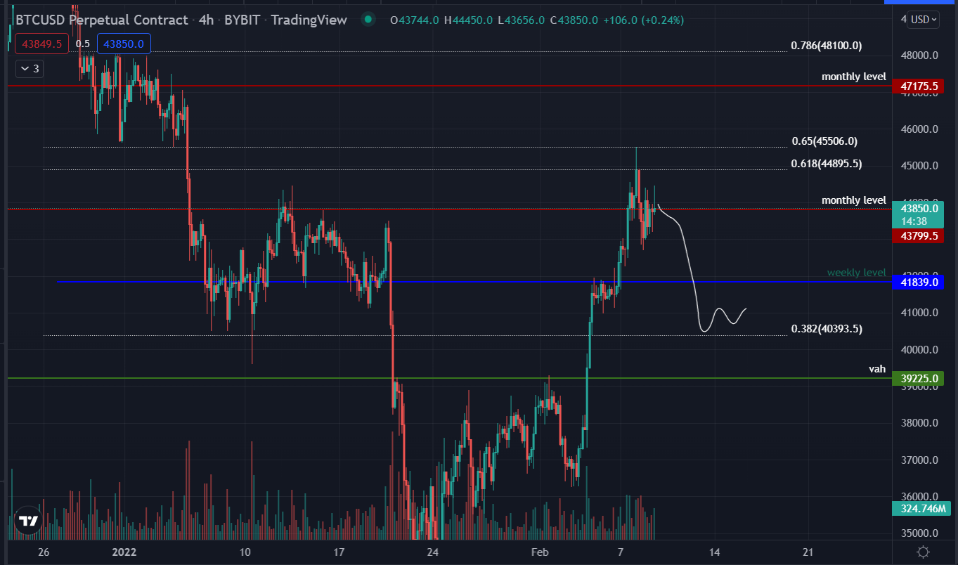
Fibonacci's retracements can help determine entry levels or so-called stop-loss orders. For example, the chart is in an uptrend and the price rises. After the move up, the price retraces to the 0.618 level, which it bounces off and starts to go up again. A trader can decide to buy, and set a stop-loss at the 0.618 level. This is because another retrace towards this level could indicate that the rally-up has failed.
Fibonacci's levels are drawn in two ways but always using two points. If the price is in an uptrend, you pick the lowest point in the chart first and then the highest point. If the price is in a downtrend, you pick the highest point first.
The Fibonacci tool is useful to help identify important levels. However, it is highly recommended to use other indicators as well to create more accurate assessments of trades and better decisions
#3 VWAP Indicator
Volume Weighted Average Price, or VWAP, is a trading indicator that averages the closing prices of a candle. At the same time, the average volume is taken into account providing a more accurate snapshot of the price action. Thus, simply said, it weighs the volume against the average price. This results in an indicator that shows if the rise, or decline, in price is backed by enough volume. On upward trending days, a trader can attempt to buy as the price bounces off VWAP. On down-trending days, one could sell as the price pushes up towards the line.
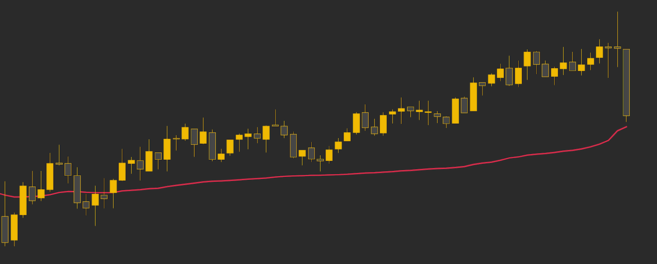
The VWAP is a lagging indicator. This means that it has no predictive qualities for prices. While the VWAP is a powerful indicator, it’s not to be interpreted in isolation. For example, an asset may be considered undervalued when the price is below the VWAP line. However, in a strong uptrend, the price may not go below the VWAP for a considerable amount of time.
#4 Pay Attention to RSI
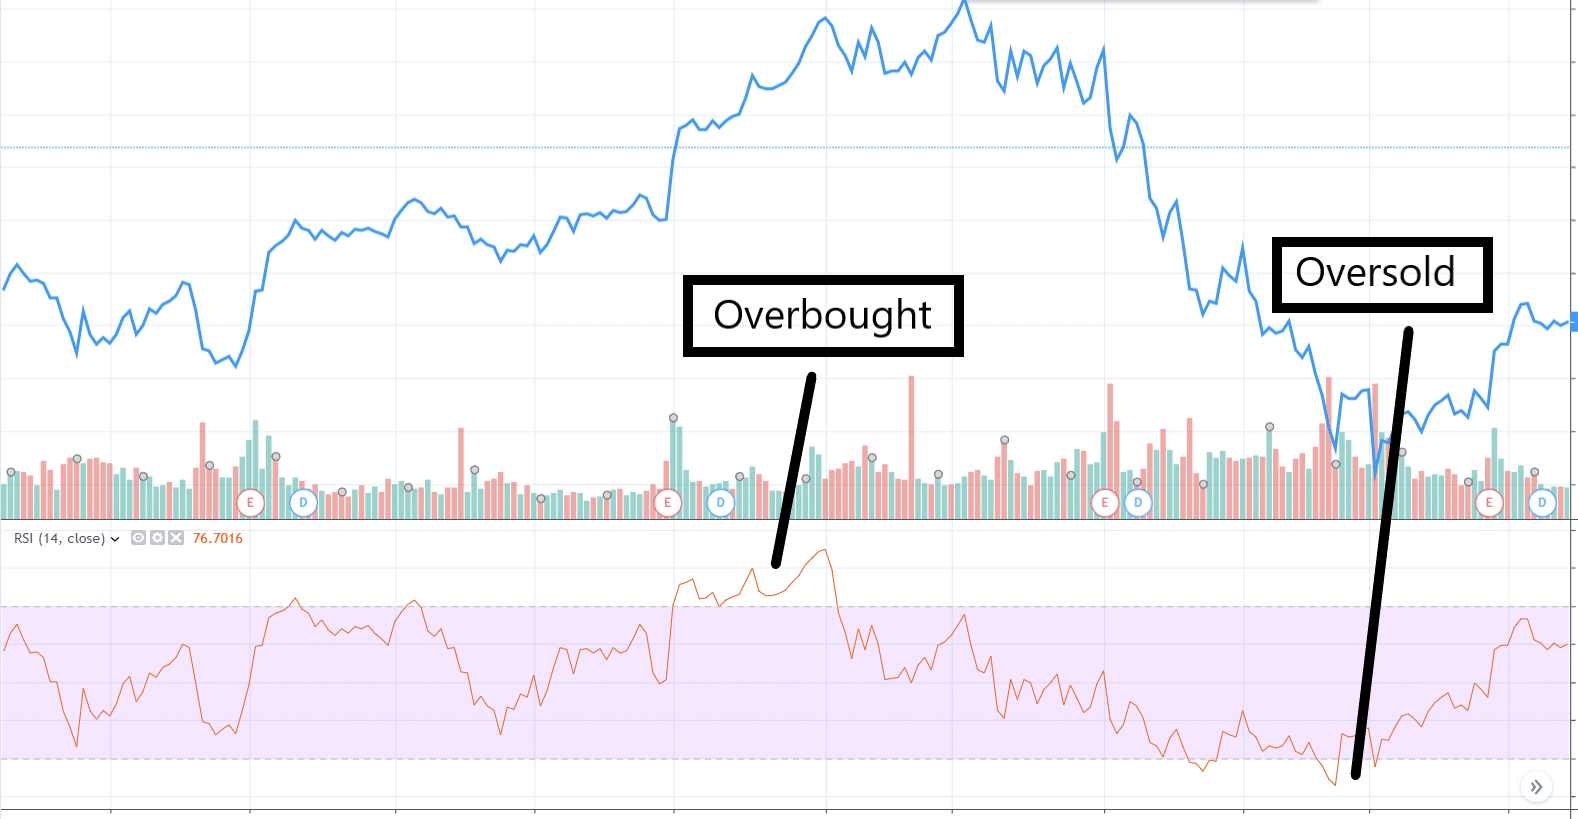
The relative strength index (RSI) is a momentum indicator used in technical analysis that measures the magnitude of recent price changes. This is done to evaluate if the asset is either overbought or oversold. The RSI can have a reading of 0 to 100. Values of 70 or above indicate that an asset or coin is becoming overbought or overvalued and a trend reversal or corrective pullback in price could occur. An RSI reading of 30 or below indicates an oversold or undervalued coin.
On most occasions, when the RSI surpasses the horizontal 30 reference level, it is a bullish sign, and when it slides below the horizontal 70 reference level, it is a bearish sign.
#5 Keep Your Calm
So you looked at every indicator listed and came up with a trading plan. Perfect. However, it is key to stick to your plan and not let your emotions intervene. By analysing the market, you came up with an approach.
Not only did you set up a stop-loss to prevent big losses, but you should have a price target set as well. The most difficult thing is to keep your emotions out of trading. For example, your plan did not work out, and you cancel your stop-loss because you think it can recover. You think with a little more room the price can recover.
Instead, the asset goes down more and your losses are even higher. Some accounts for going up. Set your price targets and realise your profit. This way you prevent greed and see your profit disappear in the pullback happening a few minutes later. Sticking to your plan is essential. Furthermore, do not trade just because you want to be in a trade. If you do not see any opportunities, do not just enter a trade just because you fear missing out. It is ok to miss a trade, there are more opportunities to come.
Final words
It is important to note that any market analysis tool shouldn’t be interpreted in isolation and works best when combined with other techniques. This entire package together should make a good first start, once studied, towards your journey to becoming a crypto trader. It is important to only trade with money you can afford to lose. I highly suggest staying as far away as possible from leveraged trading until you can truly call yourself an expert. This is to prevent huge losses. Indicators can give a potential indication. However, external factors, like news, also have an influence. So be careful.
Would you like to read more about crypto trading?
With my dedication and experience, I bring value to the projects that I get involved in. I love sharing ideas and visions because I strongly believe that the best way to learn is with the help of each other
Discover more TechBehemoths Insights
Learn practical tips and insights about IT Companies, how to find the right company for your projects.
Read the latest news about Market Trends and fresh Interviews.